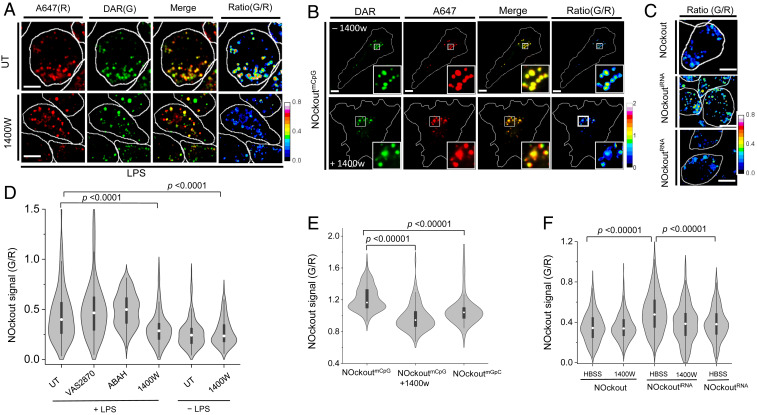
Fig. 2.
NOckoutFn detects NO in mouse primary microglia and in alveolar macrophages. (A) Representative confocal images of NOckout from LPS (1 μg/mL) primed J774A.1 macrophages in A647 (R) and DAR (G) channels in the absence (Upper) or presence (Lower) of NOS2 inhibitor 1400W. G/R intensities are represented as heat maps. (B) Representative confocal images of NOckoutmCpG from mouse primary microglia. Cells were incubated with NOckoutmCpG (500 nM) in the absence (Upper) or presence (Lower) of 1400W for 120 min in DMEM, imaged in DAR(G) and A647(R) channels, and converted into G/R heat maps. (C) Representative heat map (G/R) images of NOckout-, NOckoutiRNA-, and NOckoutRNA-treated J774A.1 cells. (D) Violin plot of the distribution of G/R values of ∼200 individual endosomes (n = 30 cells) of J774A.1 cells treated with VAS2870, ABAH, and 1400W in the presence and absence of LPS. (E) Violin plot of the distribution of G/R values of ∼100 individual endosomes (n = 20 cells) in primary microglia treated with NOckoutmCpG and NOckoutmGpC. (F) Violin plot of the distribution of G/R values of ∼200 individual endosomes (n = 30 cells) in J774A.1 macrophages treated with NOckoutRNA variants in the presence and absence of 1400W. All experiments were performed in triplicate. (Scale bar, 10 μm.) P values are obtained using Kruskal−Wallis statistical test across the dataset.

