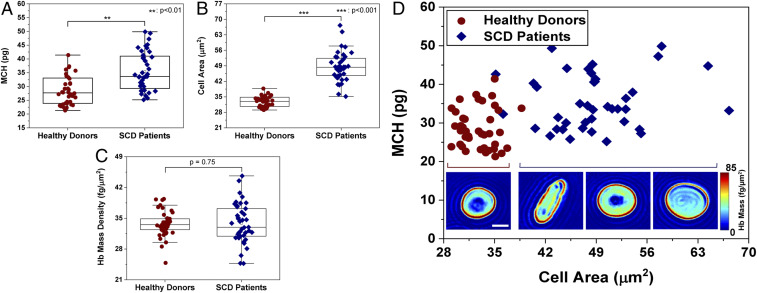
Fig. 3.
Hb characterization in healthy and sickled RBCs. (A) MCH values obtained from two healthy (n = 40) and two SCD patients (n = 40). (B) Cell area from healthy and SCD donors. (C) Average Hb mass per square area for healthy and SCD RBCs. (D) Scatter plot of MCH vs. cell area for healthy and SCD samples, with insets showing example RBC Hb mass maps (in femtograms per square micrometer). (Inset scale bar: 5 µm.)

