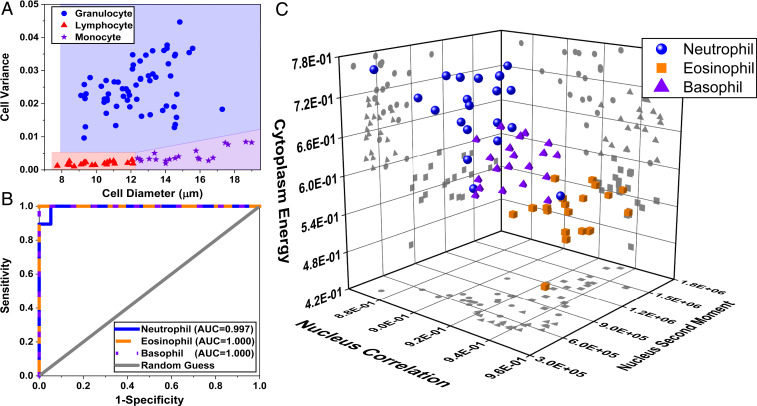
Fig. 4.
Five-part WBC differential from label-free UV images. (A) Cellular intensity variance plotted against cell diameter to perform a three-part WBC differential with blue color representing the granulocytes, red for lymphocytes, and purple for monocytes. (B) ROC curves associated with our machine learning-based granulocyte classification, thereby providing a five-part WBC differential. (C) Scatter plot of the granulocyte subtypes based on the three top-ranked features.

