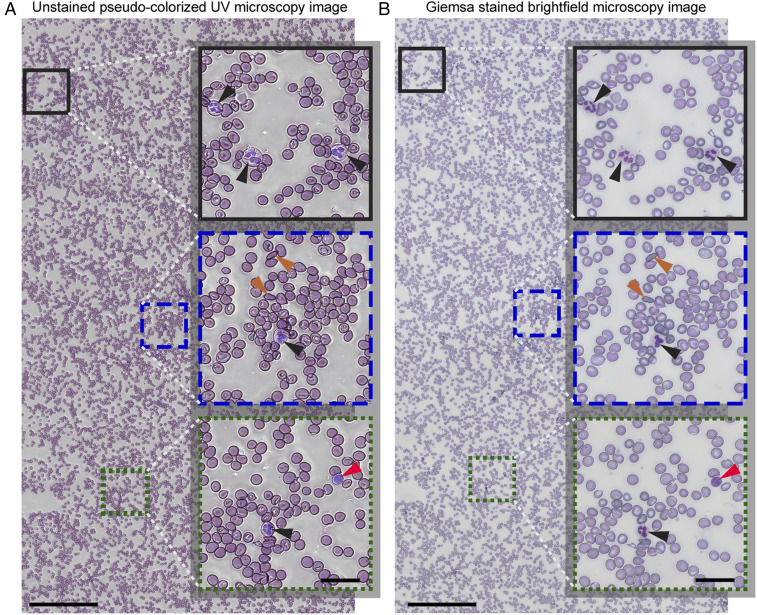
Fig. 5.
Large-area (1 × 2 mm2) fixative-free, unstained, pseudocolorized UV image of a whole blood sample collected from an SCD patient (A) along with the corresponding bright-field microscopy image after fixing and staining (B). (Scale bars: 200 µm.) The selected magnified insets highlight cellular features with black arrowheads pointing to neutrophils, orange arrowheads showing the sickled RBCs, and the red arrowheads point to lymphocytes. (Inset scale bars: 30 µm.)

