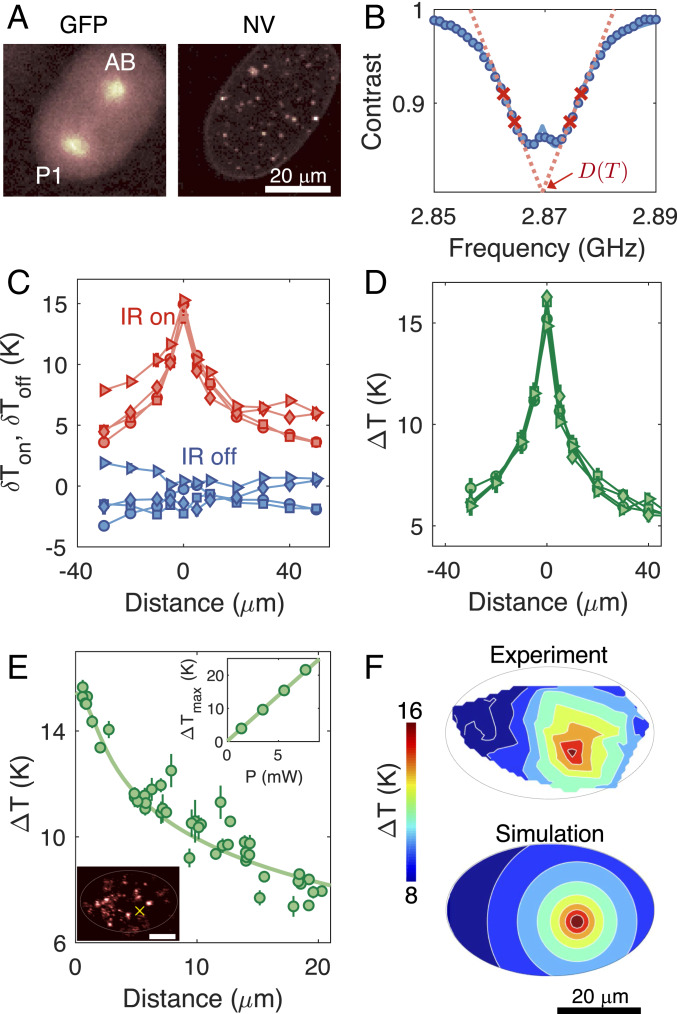
Fig. 2.
Local laser heating characterization. (A) Confocal images of the GFP-labeled embryo in the two-cell stage with GFP imaging (Left) and NV-nanodiamond fluorescence imaging (Right). (B) Optically detected magnetic resonance of an NV thermometer. Contrast is defined as the fluorescence ratio of the thermometer with and without the application of microwaves. In temperature measurements, the resonance curve is sampled at four optimized frequencies (red crosses) to extract the resonance position at a given local temperature (18). (C) In vivo temperature readout from an NV thermometer inside an embryo while sweeping the position of an IR laser relative to the thermometer. The IR laser at a fixed power of 5.7 mW is modulated on and off with a period of 30 s over the course of scanning. Each data point is averaged over 3 min, yielding a temperature uncertainty of 0.27 K. The different symbols correspond to different iterative runs. The temperature distribution curves fluctuate due to temporal variations in thermometer calibration parameters. (D) Differential temperature readout of , where are temperatures measured with the IR laser on and off. Such differential readouts reject common-mode noise, leading to different curves collapsing on top of each other and exhibiting robustness to experimental fluctuations. (E) In vivo temperature distribution measured by a collection of NV thermometers inside an embryo. Filled circles denote measured temperatures; the solid line denotes the simulated temperature profile (SI Appendix, Fig. S6). E, Lower Inset shows an image of the laser-illuminated embryo, and the yellow cross indicates the position of the IR heating laser. The bright spots in the image correspond to individual NV thermometers. (Scale bar: 20 m.) E, Upper Inset shows a linear scaling of the maximum temperature increase , as a function of the laser power . (F) The 2D temperature map of the laser-illuminated embryo, with comparisons between experiments (Upper) and simulations (Lower).

