Fig. 4.
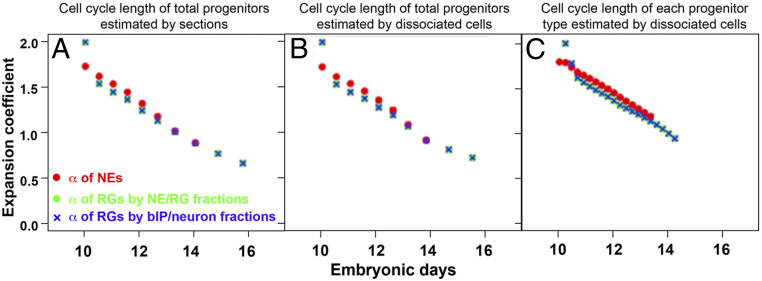
Developmental kinetics of expansion coefficients of NEs and RGs. Shown are expansion coefficients of NEs (, red circles); RGs estimated from the fraction of NEs, RGs, and bIPs/neurons (, green circles); and RGs estimated from the fraction of RGs, bIPs, and neurons (, blue cross). To estimate expansion coefficients, cell fractions as a function of embryonic stage (Fig. 1U) are converted into a function of cell division number. Compared in A–C are results of three different conversion methods. A and B use average cell cycle length of the entire progenitor population measured with cortical sections (Fig. 2K) and dissociated cortical neurons (Fig. 2L), respectively. Progenitor type-specific cell cycle lengths (Fig. 2M) are employed for C. All results shown in the plots fulfill the estimation robustness criteria (Materials and Methods), being less influenced by noise in experimental data. Expansion coefficients of NEs and RGs follow virtually identical trajectories during the corticogenesis.

