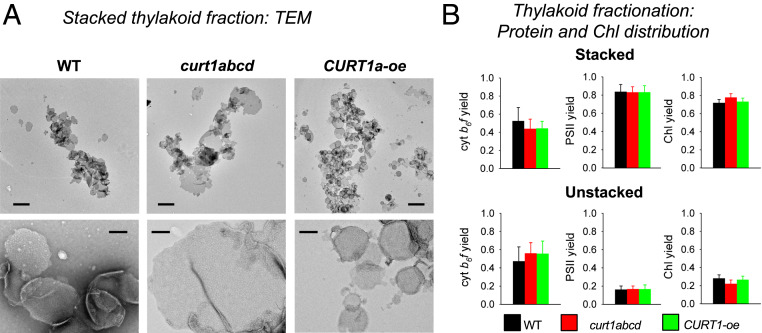
Fig. 2.
Structural characterization of stacked and unstacked thylakoid subfragments. (A) TEM images of the stacked fraction isolated from WT and curt1abcd, CURT1a-oe mutants. Some membranes are seen lying on top of each other or are folded in given darker gray layers. The numerous whitish particles in the images in the Lower panel represent PSII complexes. (Scale bars: Upper, 1 μm; Lower, 200 nm.) (B) Quantitative analysis of the distribution of cyt b6f complexes, PSII and Chl between stacked and unstacked thylakoid domains. The yield is defined as fraction of complexes (or Chl) that recovers in either the stacked or unstacked fraction (i.e., the numbers for stacked and unstacked sum up to 1). t test significance levels: *P < 0.05. Number of biological repeats: 6 to 9.

