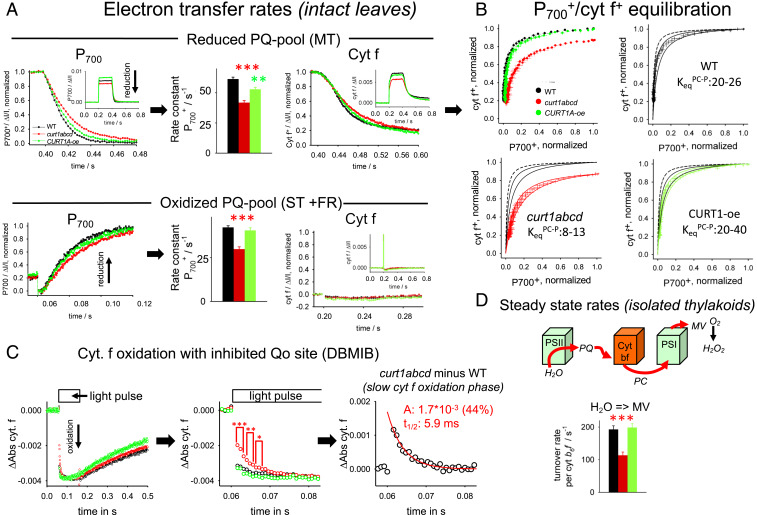
Fig. 4.
Functional characterization of PC-dependent electron transport reactions for intact leaves and thylakoids. (A) P700 and cyt f redox kinetics on leaves under reducing (Upper) and oxidizing (Lower) PQ-pool conditions. The Insets give the whole signals, whereas the main figures focus on the region where the light pulse is switched off (0.4 s for Upper). (Upper) Redox changes were induced by a 200-ms pulse on dark-adapted leaves leading to a reduced PQ pool (see Fig. 3B). (Lower) Redox changes induced by ST flash on leaves with FR background light to preoxidize the PQ pool. P700+ rereduction kinetics was analyzed either by fitting with a monoexponential function (MT) or with a set of two differential equations (ST) that describe the fast P700+ reduction by PQH2 (via cyt b6f) and its slow reoxidation by FR background in ST experiments. Cyt f+ reduction kinetics were measured in parallel with the P700+ signals. Note that as expected almost no cyt f signal is apparent for the ST FR background light experiment (Lower) since electrons from PQH2 reduce P700+ first due to its much more positive redox potential compared to cyt f, i.e., no electrons are left for cyt f+ reduction after P700+ was reduced. Number of biological repeats for each genotype: 12 for MT and 6 for ST. Error bars represent SEM. (B) Redox equilibration plots for electron transfer between cyt f (y axes) and P700 (x axes). Data were taken from MT experiments as shown in A (Upper). Error bars represent SEM. Theoretical equilibration curves (solid black, red, and green lines) were calculated from the equation: , with the equilibrium constant KeqPC-P. The equilibrium curve predicted from redox midpoint potentials of cyt f (+355 mV) and P700 (+480 mV; SI Appendix, Fig. S2) is shown as dashed black curve. For curt1abcd, the maximal oxidation level reaches 0.87 with the 200-ms light pulse. Please see the text for details. (C) Cyt f oxidation by PSI in the presence of the Qo site inhibitor dibromothymoquinone (DBMIB) (blocks PQH2 oxidation). We noted that P700 oxidation in the same experiment is homogenously fast for all three genotypes. Under these conditions, cyt f oxidation reflects only PC-mediated electron transport to PSI without interference by electron flux from PQH2. Left, Overview. The slow cyt f+ reduction after the light pulse is indicative of successful inhibition by DBMIB. Middle, Zoom in to the oxidation phase revealing a slow cyt f component for curt1bcd. Right, Kinetic analysis of the curt1abcd-specific slow cyt f phase determined by subtracting the curt1abcd signal from WT. Kinetics shows an average of 14 to 21 biological replicates. (D) Steady-state electron transport rates for fresh isolated thylakoid membranes determined from polarographic oxygen measurements in the presence of the ΔpH uncoupler nigericin. MV, methylviologen. Electron transport rates are expressed relative to cyt b6f. Number of biological repeats for each genotype: 5 to 14. Error bars represent SEM. t test significance levels: *P < 0.05, **P < 0.01, ***P < 0.001.

