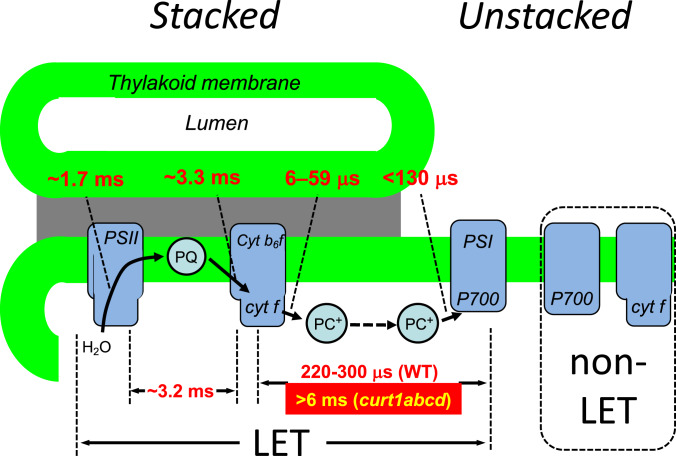
Fig. 6.
Electron transfer times in LET. The cartoon summarizes electron transfer times either measured in this study or taken from the literature. Data from the literature: 1) Electron transfer from PC bound to the cyt b6f complex (6 to 59 μs): Calculated with with (k) of 1.7⋅107 M−1⋅s−1 (61) to 4.5⋅107 M−1⋅s−1 (62), the [PC] = 3.6 mM, and [cyt f] either 0.27 mM (only cyt b6f in stacked) or 0.51 mM (all cyt b6f complexes). 2) Total electron transfer time between cyt f and P700 of 220 to 300 μs from refs. 19, 42, and 43. 3) Electron transfer from PC to P700 for PSI-bound PC from ref. 62. The 130 μs gives an upper estimate for this electron transfer step since it represents the rate-limiting unbinding of PC from PSI (62). 4) cyt b6f complex turnover of 3.3 ms (63). All other numbers were determined in this study. Cyt b6f complexes not participating in LET are indicated on the Right. These complexes can but must not necessarily participate in CEF. Therefore, they were labeled “non-LET.” The different situation in curt1abcd is shown in red box.

