
Fig. 12.
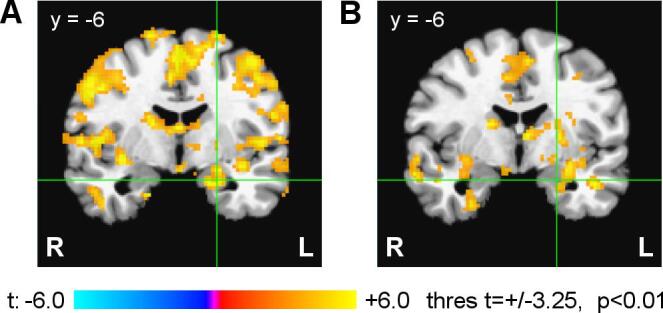
Comparison of the FAA- and FBA-based PPI interaction effects for the left amygdala region. A) FAA-based PPI interaction effects from Fig. 11. B) FBA-based PPI interaction effects from Supplementary Fig. S8. The green crosshairs (x = −21 mm, z = −16 mm) correspond to the center of the LA target ROI. (For interpretation of the references to color in this figure legend, the reader is referred to the web version of this article.)