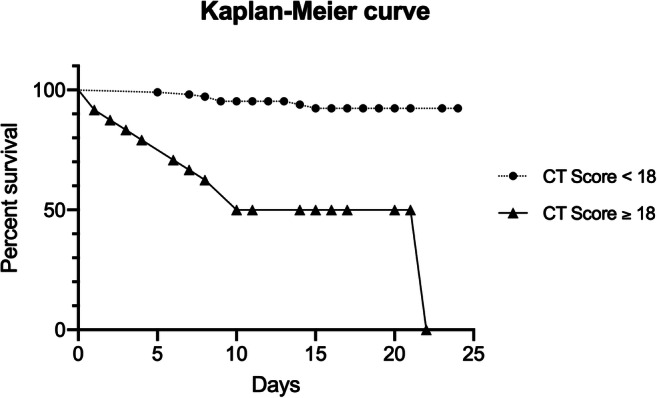
Fig. 5.

Kaplan-Meier survival curve. Estimated survival rate comparison between SARS-CoV-2+ patients with CT score < 18 and ≥ 18. Percentage of survival is expressed on the y-axis, while time (days) of the observation period is expressed on the x-axis
