Fig. 2.
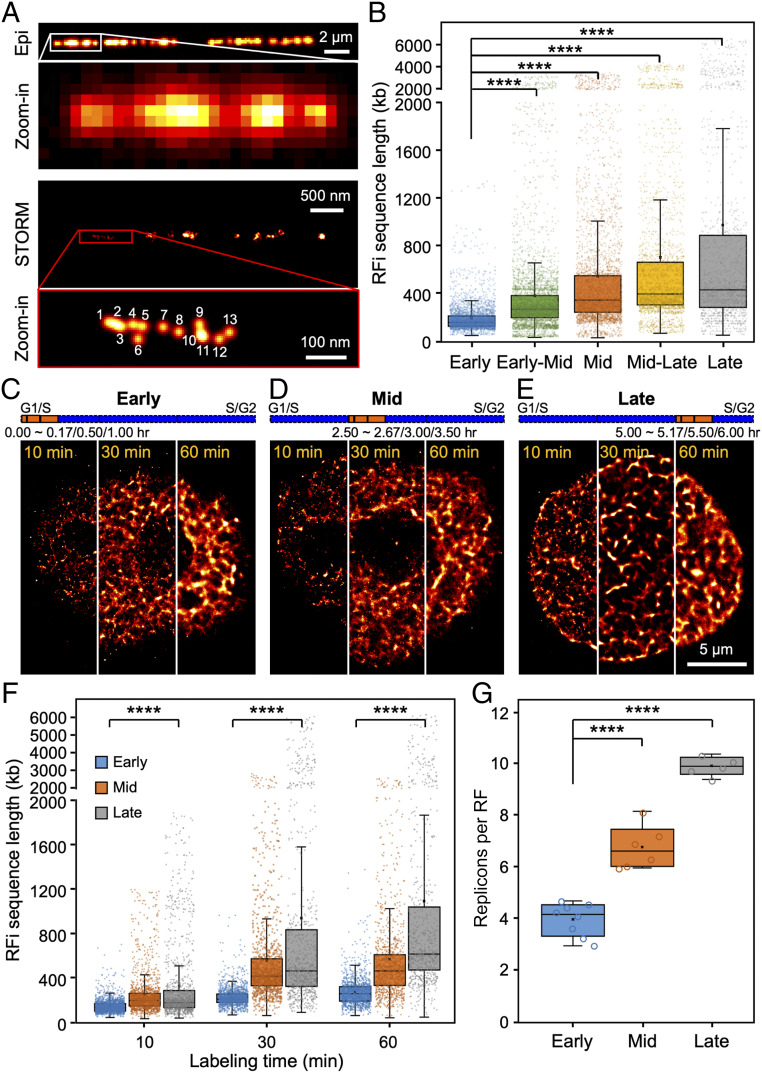
Quantification of sequence length and replicon number of individual RFi across S-phase. (A) Conventional and STORM images of Alexa 647-EdU–labeled replication sites on a single stretched DNA molecule; the physical length of the DNA molecule can be directly measured and converted into base pair length (29, 64). Inset in the STORM image (red box) shows a zoomed-in area, where single-molecule localizations can be directly counted. (B) Sequence length associated with individual RFi during each of the five stages imaged in Fig. 1A. (C–E) STORM images of cells with their newly replicated DNA labeled for 10 min, 30 min, or 60 min, respectively, at the beginning of early (C), mid (D), and late (E) S-phase. For more visual comparison, each image is stitched from three different cells, each labeled for 10 min, 30 min, and 60 min, respectively. The orange bars at the top indicate the relative temporal position of the labeling periods during S-phase (blue bars, not drawn to scale). (F) Sequence lengths of RFi replicated during different labeling durations at early, mid, and late S-phase. (G) Number of replicons per replication focus in early, mid, and late S-phase. Data are shown as box-and-whisker plots. Each dot denotes a single RF, and each circle denotes a single cell. P values are determined by two-tailed Student’s t test; ****P < 0.0001. n = 3,503, 4,556, 3,829, 2,566, and 1,509 RFi from 10∼13 cells at each stage for B; 1,962, 1,441, and 1,254 (10 min), 1,443, 1,214, and 1,125 (30 min), 1,146, 865, and 709 (60 min) RFi from 5∼8 cells at each stage for F; and 5∼8 cells for G. Source data are provided as Dataset S1.

