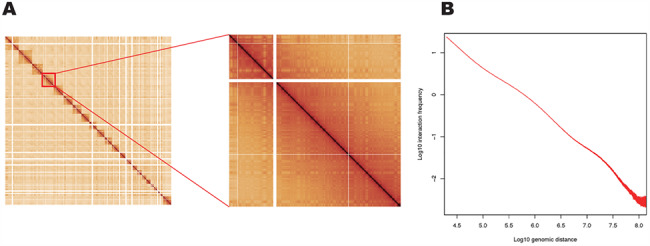
Figure 1.

Features of Hi-C data that facilitate genome reconstruction. (A) A whole-genome Hi-C contact matrix for the GM12878 cell line (22) showing chromosome territories (squares along diagonal are individual chromosomes). Intra-chromosomal contacts are higher than inter-chromosomal contacts. (B) Average Hi-C interaction frequency as a function of genomic distance separating interacting bins at a bin size of 10 kb. The plot shows a typical distance-dependent decay curve.
