
Figure 3.
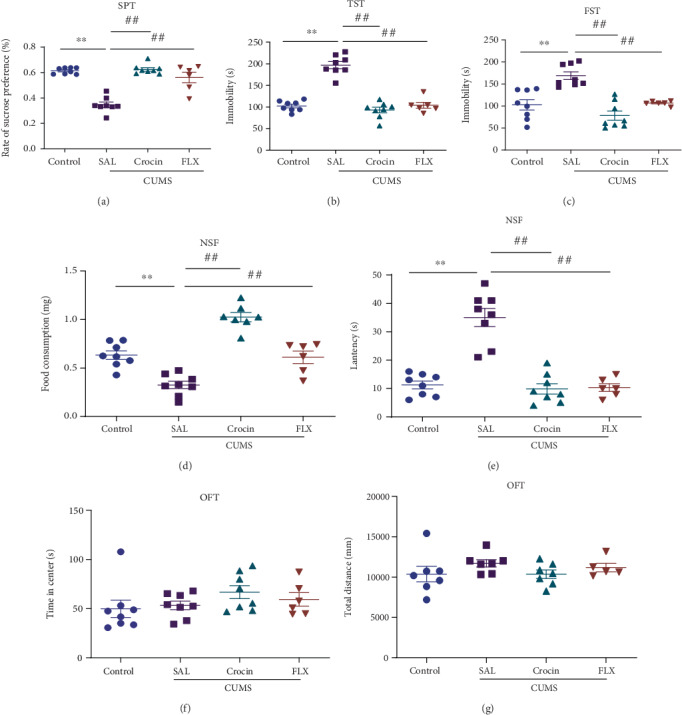
Crocin recovered CUMS-induced depression-related behavior. (a) The sucrose preference test. ANOVA, F (3, 26) = 38.07, P < 0.0001. (b, c) The immobility time in TST and FST. ANOVA, F (3, 26) = 56.74, P < 0.0001; ANOVA, F (3, 26) = 16.72, P < 0.0001. (d, e) The food consumption and feeding latency in NSF. ANOVA, F (3, 25) = 37.15, P < 0.0001; ANOVA, F (3, 26) = 33.55, P < 0.0001. (f, g) The total distance and time in center in OFT. ANOVA, F (3, 22) = 1.019, P = 0.4031; ANOVA, F (3, 26) = 1.238, P = 0.3162. All data are expressed as mean ± SEM. ∗P < 0.05, ∗∗P < 0.01 versus saline; #P < 0.05, ##P < 0.01 versus CUMS.