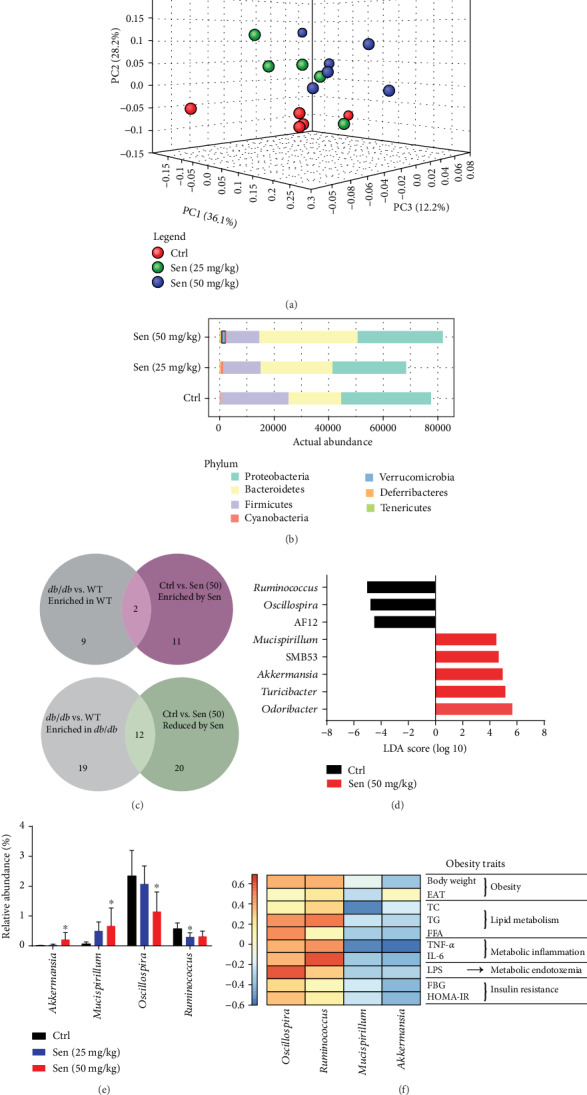
Figure 3.

Sennoside A reversed gut dysbiosis of db/db mice. (a) Principal-coordinate analysis based on the weighted UniFrac index with the PERMANOVA significance test. (b) The relative abundance of microbial taxa was determined on the phylum level of which abundances of >1% were shown as representative. (c) Venn diagram illustrated the number of bacterial OTUs that were differentially abundant between the indicated mice. See also Figure S3C. (d) Linear discriminant analysis (LDA) scores derived from LEfSe analysis, showing the biomarker taxa on the genus level (LDA score) of >4 and a significance with p < 0.05 determined by the Wilcoxon signed-rank test. (e) The relative abundance of bacteria genus by different doses of Sennoside A whose levels were altered in the same direction in Sen vs. Ctrl and WT vs. db/db. (f) Spearman's correlation analysis between the 4 Sennoside A-shifted genus and obesity traits. False discovery rate correction for multiple testing was used.
