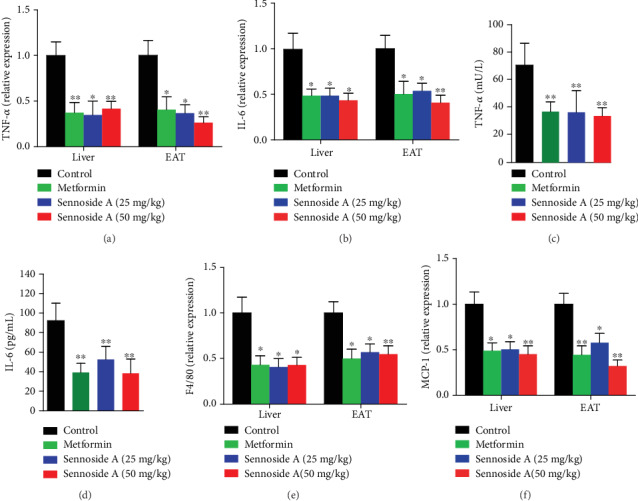
Figure 4.

Sennoside A reduced proinflammatory genes and cytokines in the liver and EAT. Relative mRNA expression levels of proinflammatory genes (a) Tnf and (b) Il6 in the liver and EAT. Serum cytokines (c) and TNF-α (d) of db/db mice with or without Sennoside A treatment after 12 weeks. Relative mRNA expression levels of (e) Adgre1 and (f) Ccl2 in the liver and EAT (n = 5).
