Figure 5.

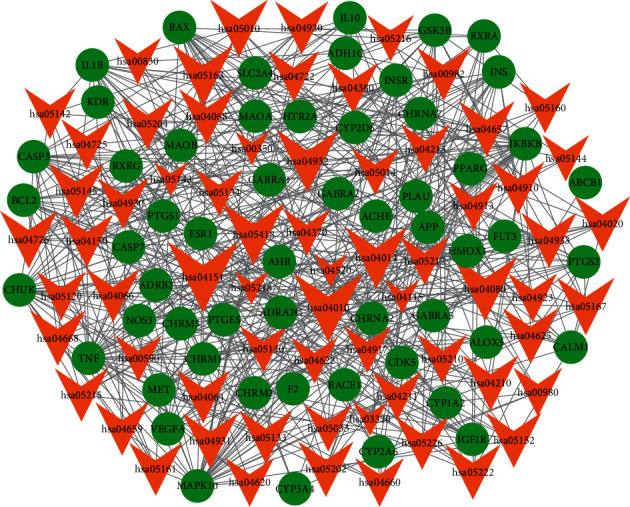
Target-pathway networks of ATR and CR. The green nodes are the targets of ATR and CR, while the orange nodes represent the pathways.

Target-pathway networks of ATR and CR. The green nodes are the targets of ATR and CR, while the orange nodes represent the pathways.