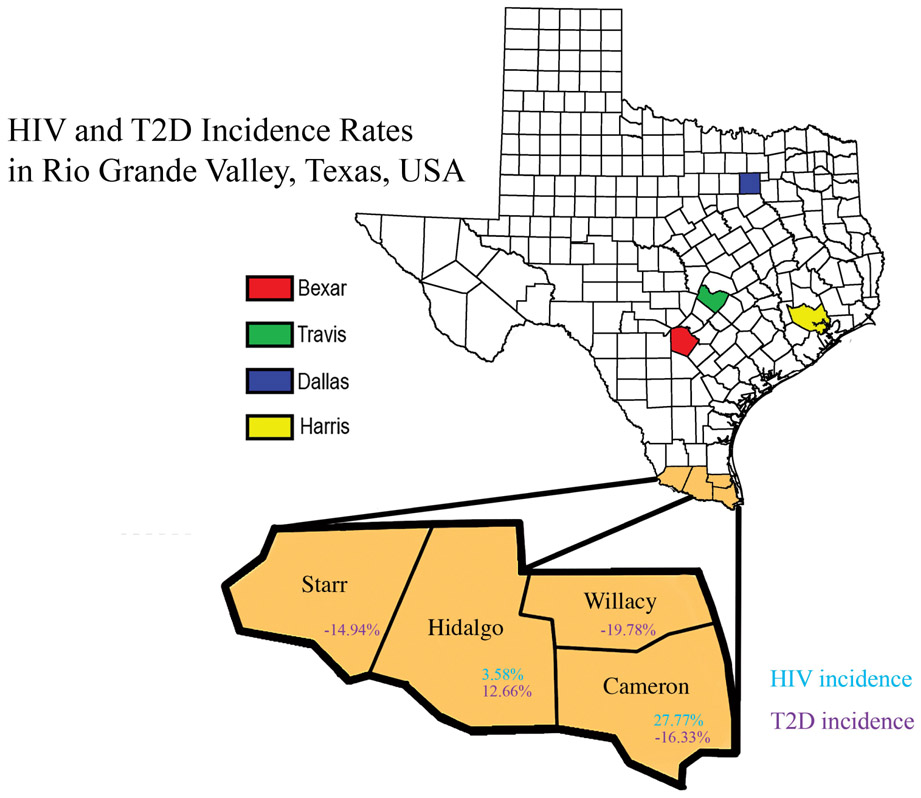
Fig. (1).
The map illustrates the different counties of the RGV’s HIV and T2D incidence rates. The percentage difference was calculated to analyze the increase in HIV incidence rates from 2007-2015 in the RGV. Hidalgo county had a 3.58% increase while Cameron County had 27.77%. In 2007 TDSHS HIV census reported zero new cases in Starr and Willacy County; therefore, no percentage difference was calculated. According to our statistical analysis, T2D incidence rate from 2004 to 2013 in Hidalgo County were increased by 12.66% whereas the incidence rates in Cameron, Willacy, and Starr counties were decreased.

