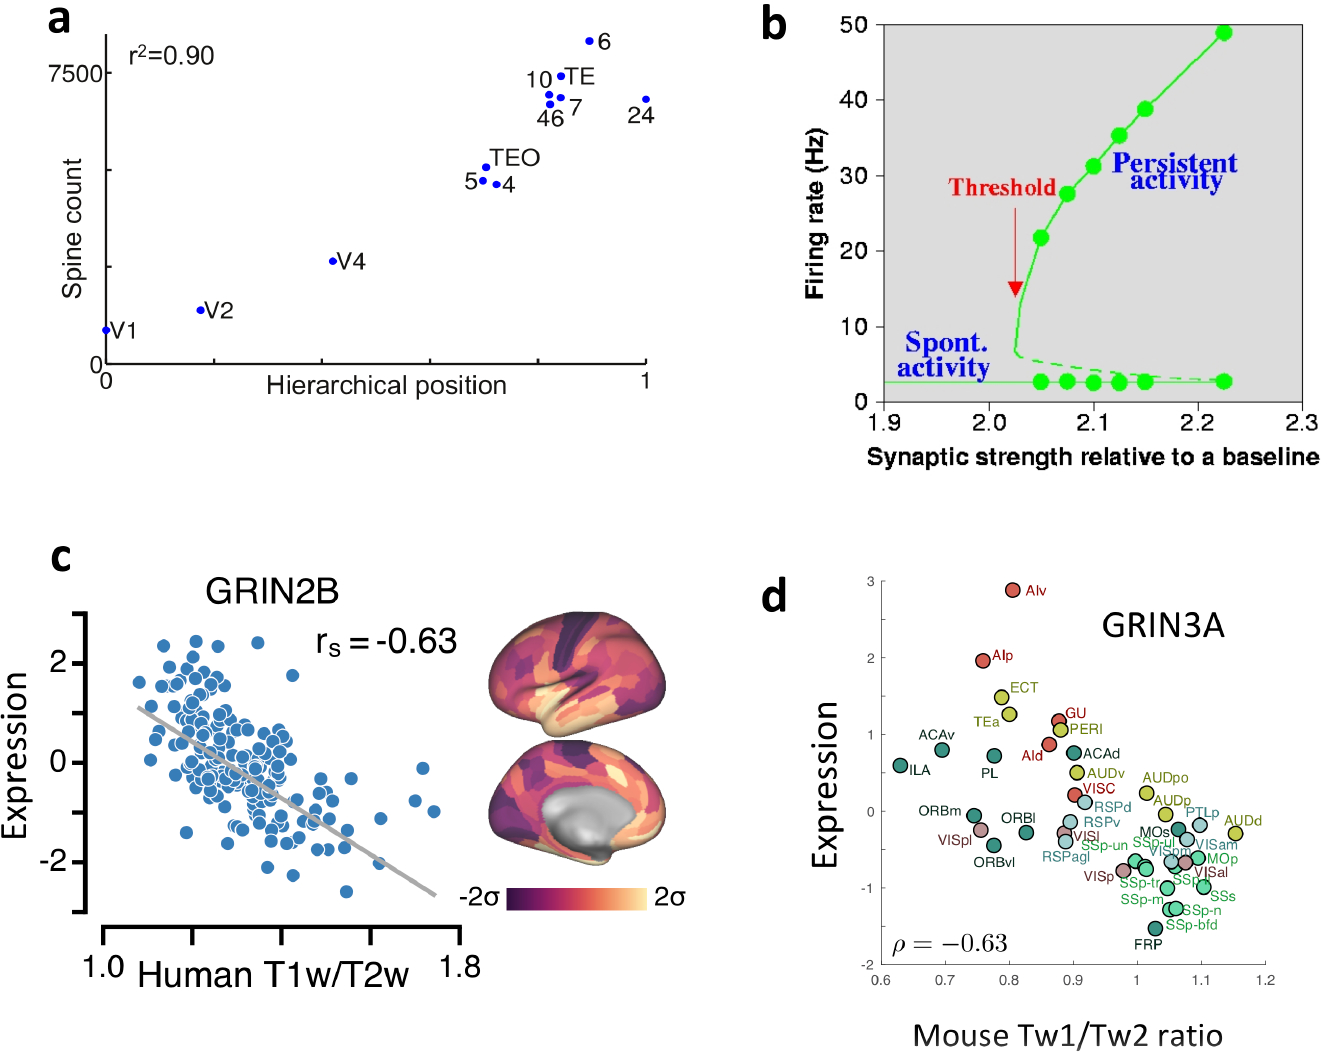
Fig. 1 |. Macroscopic gradients of synaptic excitation and bifurcations.

a | The number of spines on the basal dendrites of layer 3 pyramidal cells in an area of macaque cortex is strongly correlated with the area’s hierarchical position, as determined by layer-dependent projections. b | Self-sustained network states are shown by their neural firing rates (y-axis) as a function of the strength of recurrent synaptic connectivity (x-axis) in a local circuit model. Solid lines represent the spontaneous state and the mnemonic persistent memory state; dashed line: unstable states. Above a critical threshold of synaptic strength, persistent activity appears abruptly as an all-or-none bifurcation phenomenon. c | Across different areas of human cortex, the expression of GRIN2B, which encodes the NMDA receptor subunit NR2B, negatively correlates with MRI-derived T1-weighted/T2-weighted (T1w/T2w) ratio. d | In mouse cortex, Grin3a, which encodes the NMDA receptor NR3A subunit, is expressed as a function of T1w/T2w ratio. ρ, Pearson correlation coefficient; 2, somatosensory area 2; 7A, area 7A; 7B, area 7B; 7m, area 7m; 8l, lateral part of area 8; 8m, medial part of area 8; 9/46d, dorsal part of area 9/46; 9/46v, ventral part of area 9/46; 10, area 10; 24c, area 24c; TEO, area TEO; TEpd, posterior-dorsal part of area TE; rs, Spearman rank coefficient; V1, primary visual cortex; V4, visual area 4. Parts a is adapted from ref. 30. Part b is adapted from ref. 36. Part c is adapted from ref. 43. Part d is adapted from ref. 48.
