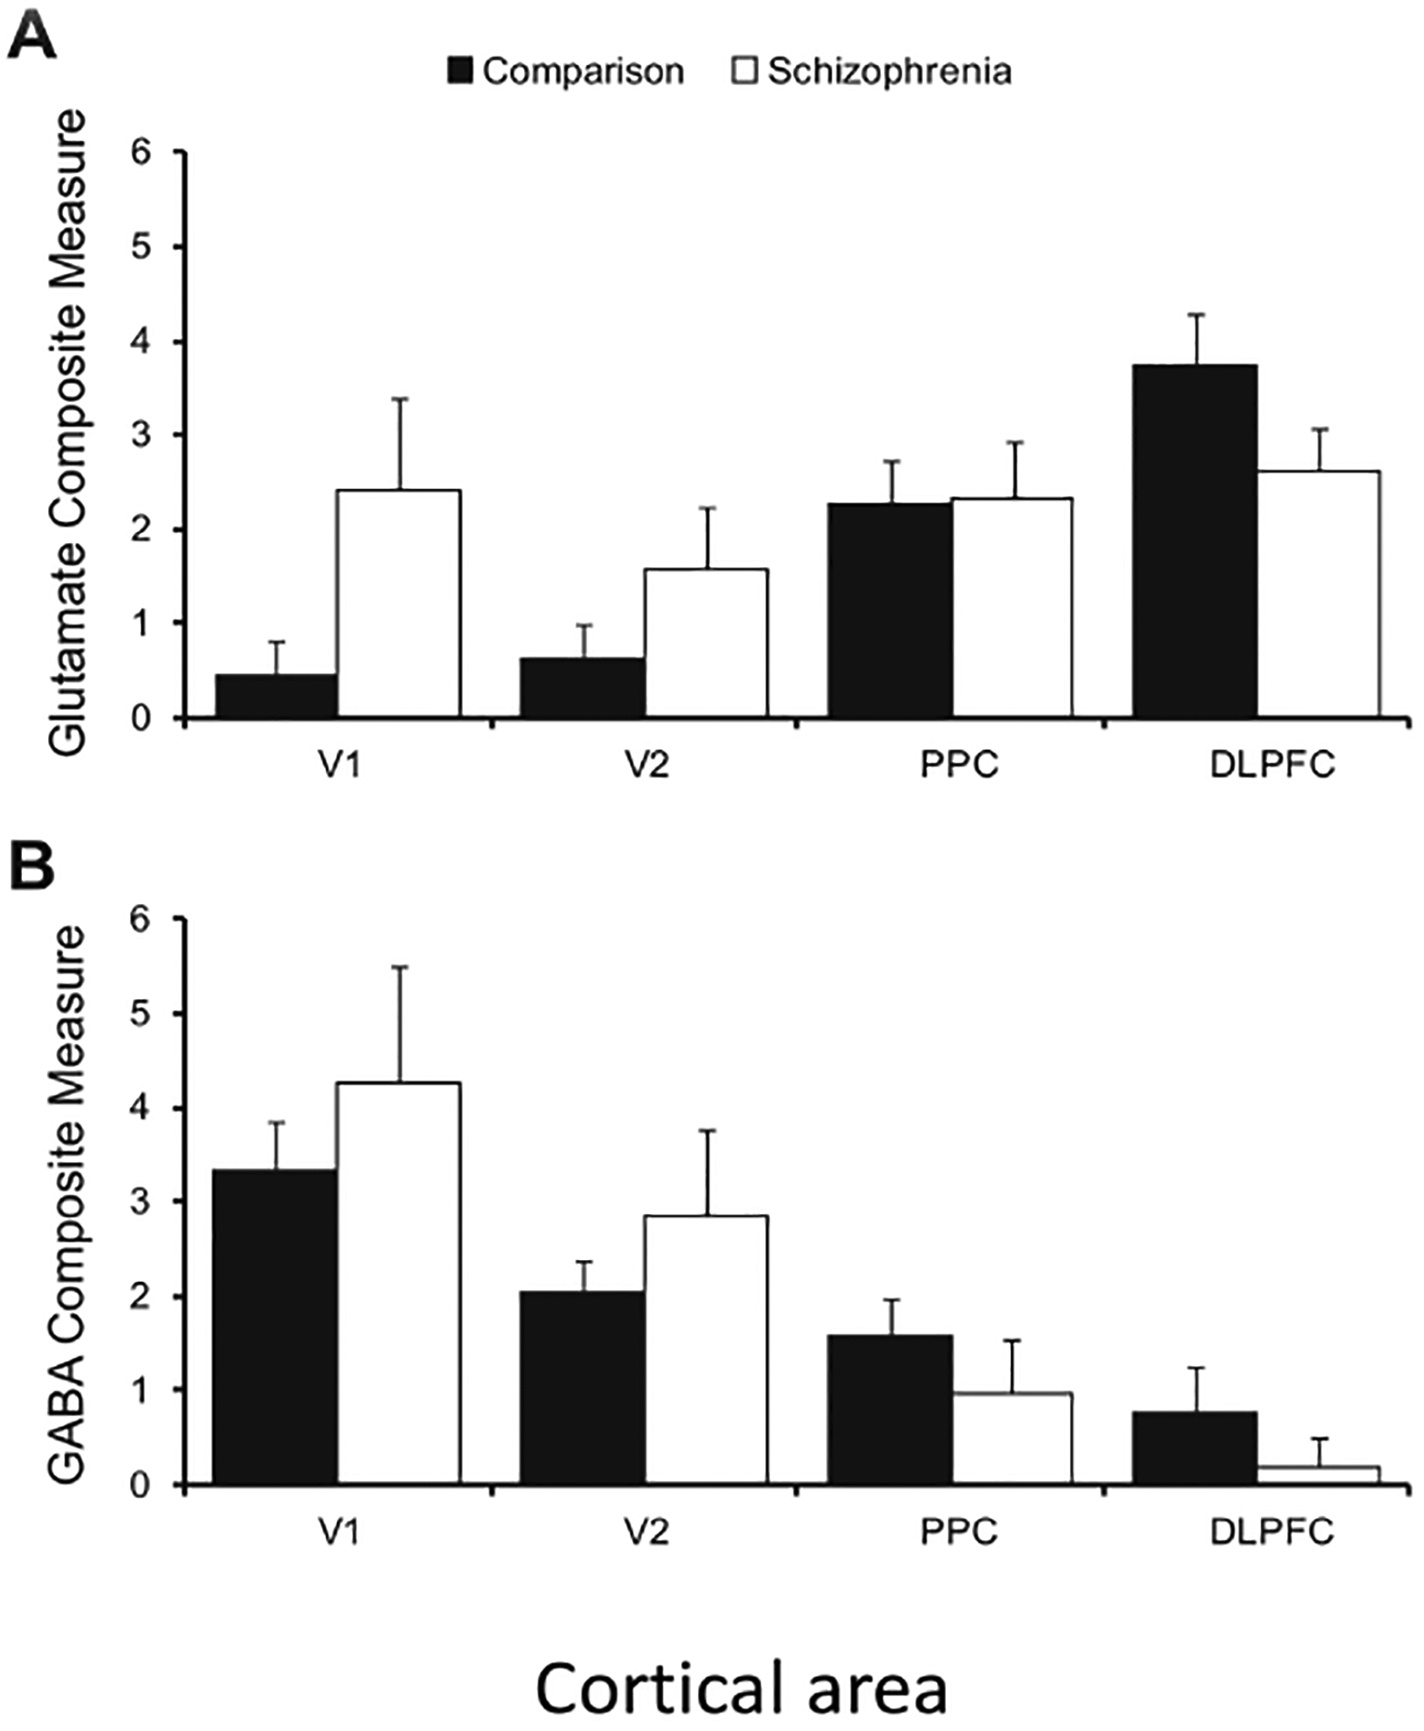
Fig. 4 |. Macroscopic gradients in schizophrenia.

A comparison of postmortem brains of healthy controls and individuals with schizophrenia examined composite measures of glutamate-signalling-related and GABA-signalling-related transcripts in the visuospatial working-memory network. In control brains (filled bar), the composite glutamate signalling (top) and GABA signalling measures (bottom) showed marked, and opposing, caudal-to-rostral gradients. However, in individuals with schizophrenia (open bar), the gradient was lost for the glutamate-signalling measure, but enhanced for the GABA-signalling measure. Error bars represent variability across each group of 20 individuals. DLPFC, dorsolateral prefrontal cortex; PPC, posterior parietal cortex; V1, primary visual cortex; V2, Brodmann area 18. Figure reproduced from ref. 96.
