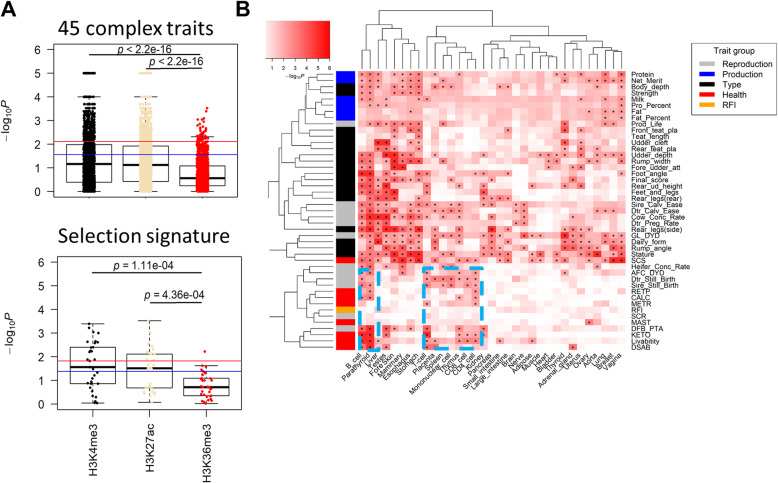
Fig. 3.
Enrichment analysis for 45 complex traits and selection signature in cattle. a Comparisons of GWAS (up) and selection signature (down) enrichments among tissue-specific H3K4me3, H3K27ac, and H3K36me3 (top 5%). Student t test was used to compare the enrichments between H3K4me3/H3K27ac and H3K36me3. Blue line denotes P < 0.05; red line denotes FDR < 0.05. b Association of tissues with complex traits based on GWAS signal enrichment analyses using tissue-specific H3K4me3 (top 5%). Blue boxes contain associations of health and reproduction traits with immune related tissues. “*” denotes FDR < 0.05

