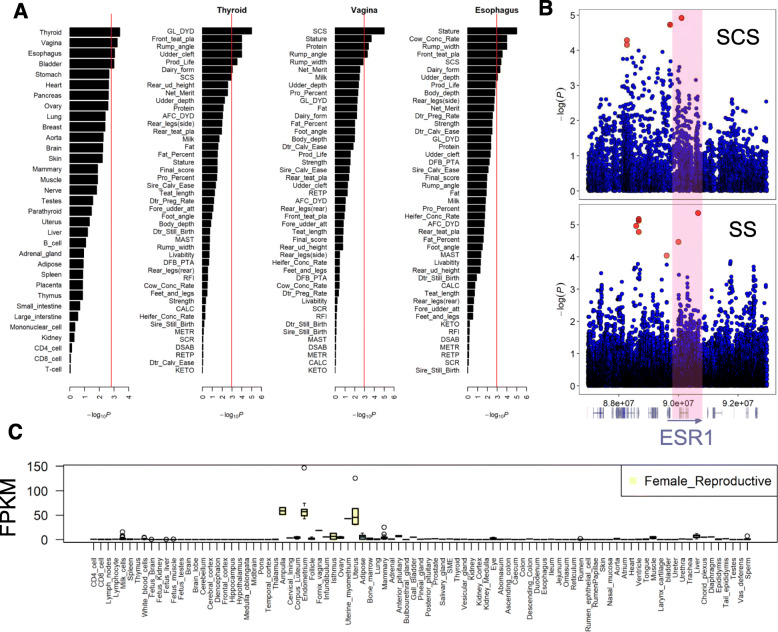
Fig. 4.
Enrichment of selection signature across multiple tissues. a The first bar plot is for enrichment of selection signature in tissue-specific H3K4me3 across multiple tissues. The second, third, and fourth ones are for associations of traits with thyroid, vagina, and esophagus, respectively, based on GWAS signal enrichments of tissue-specific H3K4me3. The red line denotes FDR < 0.05. b An example of shared peaks between selection signature (SS) and GWAS of somatic cell scores (SCS). ESR1 gene, which shows tissue-specific H3K4me3 signals in vagina, locates within the peak. c Gene expression of ESR1 in 91 bovine tissues

