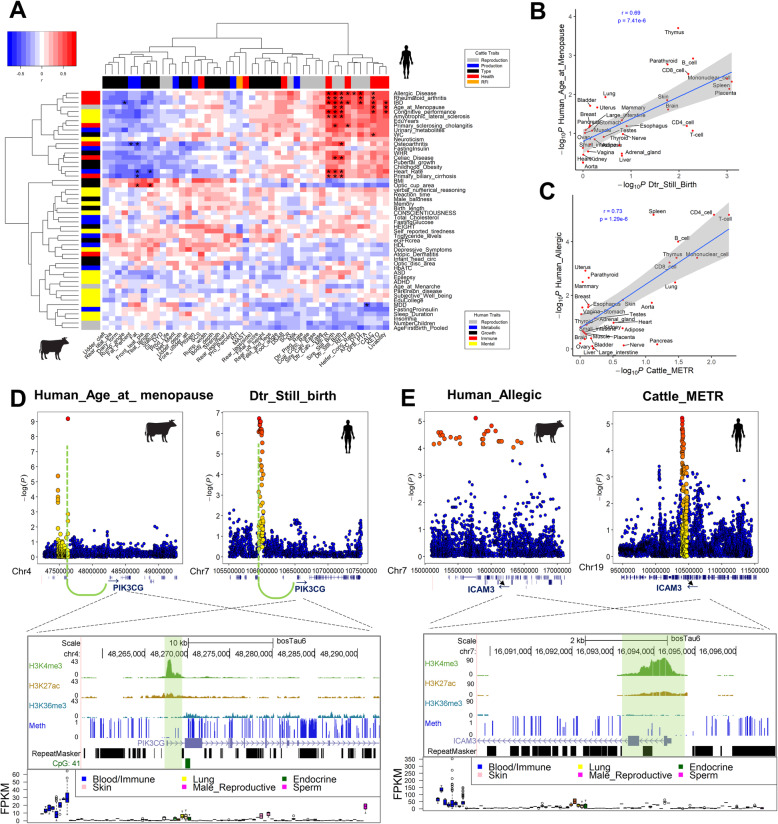
Fig. 6.
Shared genetic architecture between human diseases/traits and cattle traits. a Correlations of complex traits between human and cattle based on GWAS signal enrichment of tissue-specific H3K4me3 (top 5%) across all tested tissues. “*” denotes FDR < 0.05. b Correlation between age at menopause in human (Human_Age_at_menopause) and daughter still birth (Dtr_Still_Birth) in cattle. c Correlation between allergic disease (Human_Allergic) in human and metritis (Cattle_METR) in cattle. d, e Examples of two genes, PIK3CG and ICAM3, with tissue-specific H3K4me3 in mononuclear cells and T cells, respectively. Dots plots (up) are GWAS peaks within 1 Mb regions of the genes in cattle and human. UCSC browser tracks of genes (down) include transferred H3K27ac, H3K4me3, H3K9ac, H3K36me3, and measured DNA methylation (Meth) data in cattle. Below are the tracks for gene expressions of PIK3CG and ICAM3 in 91 bovine tissues. Green curve lines in d indicate a capture Hi-C contact between PIK3CG and GWAS signal peaks (~ 610 kb upstream) in human and cattle

