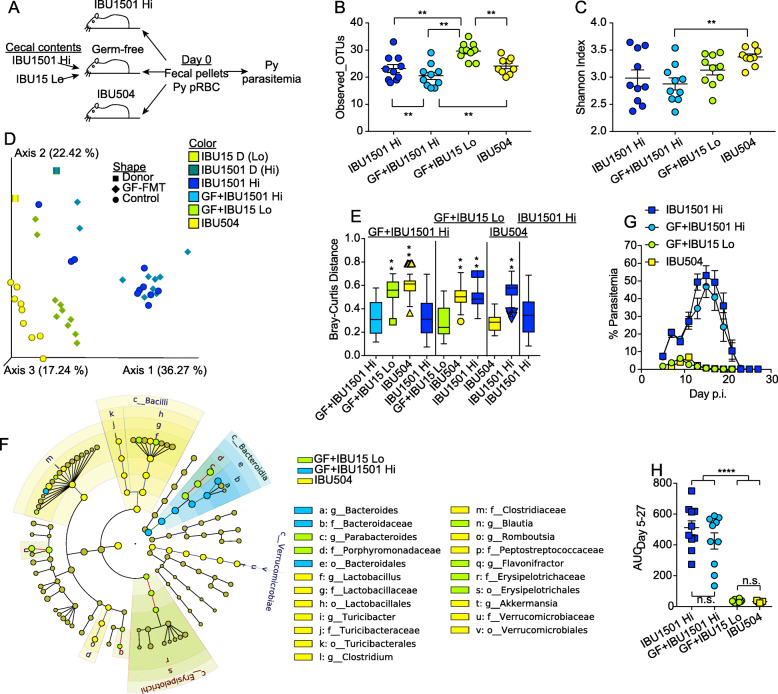
Fig. 3.
Shift in gut bacteria populations within Taconic C57BL/6N production suite causes differential severity of malaria. a Schematic of the experimental design. IBU1501 Hi = shipment of IBU1501 mice post-2017, IBU15 Lo = IBU15 mice from same shipment on August 2016 as reported in Fig. 1a, b. The cecum from the August 2016 mice (IBU15 Lo) had been removed and stored at − 80 °C. Ceca microbiota from IBU1501 Hi and IBU15 Lo were gavaged to GF mice in SPF facility and after 1 week were infected with P. yoelii 17XNL. The experiments were independently performed twice. b, c Fecal bacterial populations were profiled with alpha diversity using Observed_OTUs (b) and Shannon index (c). Data (mean ± S.E.) were analyzed by the Kruskal-Wallis test. d The PCoA plot shows beta diversity using the Bray-Curtis distance. e Statistical significance of beta diversity. The box end depicts the lower and upper quartiles and the horizontal line inside the box is the median while points outside the whisker are outliers. The Y-axis shows the distance of IBUs on the X-axis to IBUs on the top of vertical columns. Statistical significance is compared between IBUs on top of vertical columns to IBUs on the X-axis by pairwise PERMANOVA with 999 permutations. f Cladogram shows differentially abundant bacterial taxa among different groups with respective node color identified using LEfSe analysis. The cutoff for the LEfSe method was p < 0.05 (Kruskal-Wallis test) with LDA score > 4. g Parasitemia of mice on the indicated day post-Py infection. h Parasitemia AUC days 5–27 from f. Data are cumulative results with 9–10 mice per group from two experiments with each symbol representing an individual mouse. Data (mean ± S.E.) were analyzed by one-way ANOVA with Tukey’s multiple comparisons test. **p < 0.01, ***p < 0.001, ****p < 0.0001

