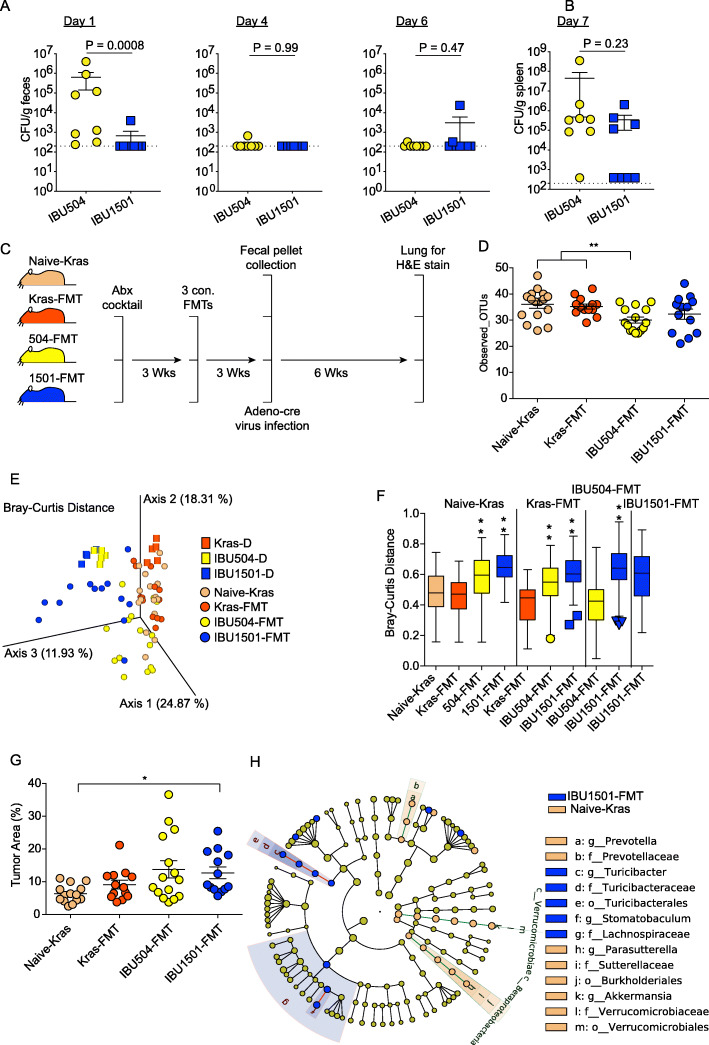
Fig. 4.
Difference in Taconic gut bacteria populations impacts reproducibility in infectious (Salmonella) and non-infectious (lung tumor) disease models. a C57BL/6N mice from the indicated IBUs at Taconic were infected with S. enterica serovar Typhimurium. S. enterica serovar Typhimurium bacterial burden was determined by measuring the number of colony-forming units (CFU) per gram of feces (a) or spleen (b) on the indicated day post-infection. Each symbol represents an individual mouse. Data (mean ± S.E.) are cumulative results with 7–8 mice per group from two experiments and were analyzed by the Mann-Whitney test. c Schematic of the lung tumor model. Two independent experiments were conducted with n = 8 per group. Kras mice were treated with antibiotics, received fecal microbiota transplantation (FMT) from naïve mice having low or high Py parasite burden, and infected with Adeno-cre virus for the spontaneous development of lung tumor. d–f Fecal pellets were collected and subjected to 16S rRNA gene sequencing. Data were analyzed at 19,000 sequencing depth per sample. d Alpha diversity using Observed_OTUs. Data (mean ± S.E.) were analyzed by the Kruskal-Wallis test. e The PCoA plot shows beta diversity using the Bray-Curtis distance. f Bray-Curtis dissimilarity index between indicated samples. The box end depicts the lower and upper quartiles and the horizontal line inside the box is the median while points outside the whisker are outliers. The Y-axis shows the distance of IBUs on the X-axis to IBUs on the top of vertical columns. Statistical significance is compared between IBUs on top of vertical columns to IBUs on the X-axis by pairwise PERMANOVA with 999 permutations. g Lung tumor burden in different groups of Kras mice as shown in c. Data (mean ± S.E.) were analyzed by the Kruskal-Wallis test and post hoc analysis with Dunn’s test. h Cladogram shows differentially abundant bacterial taxa between two IBUs having significantly different lung tumor burden with respective node color calculated using LEfSe analysis. The cutoff for the LEfSe method was p < 0.05 (Kruskal-Wallis test) with LDA score > 4. *p < 0.05, **p < 0.01, ***p < 0.001

