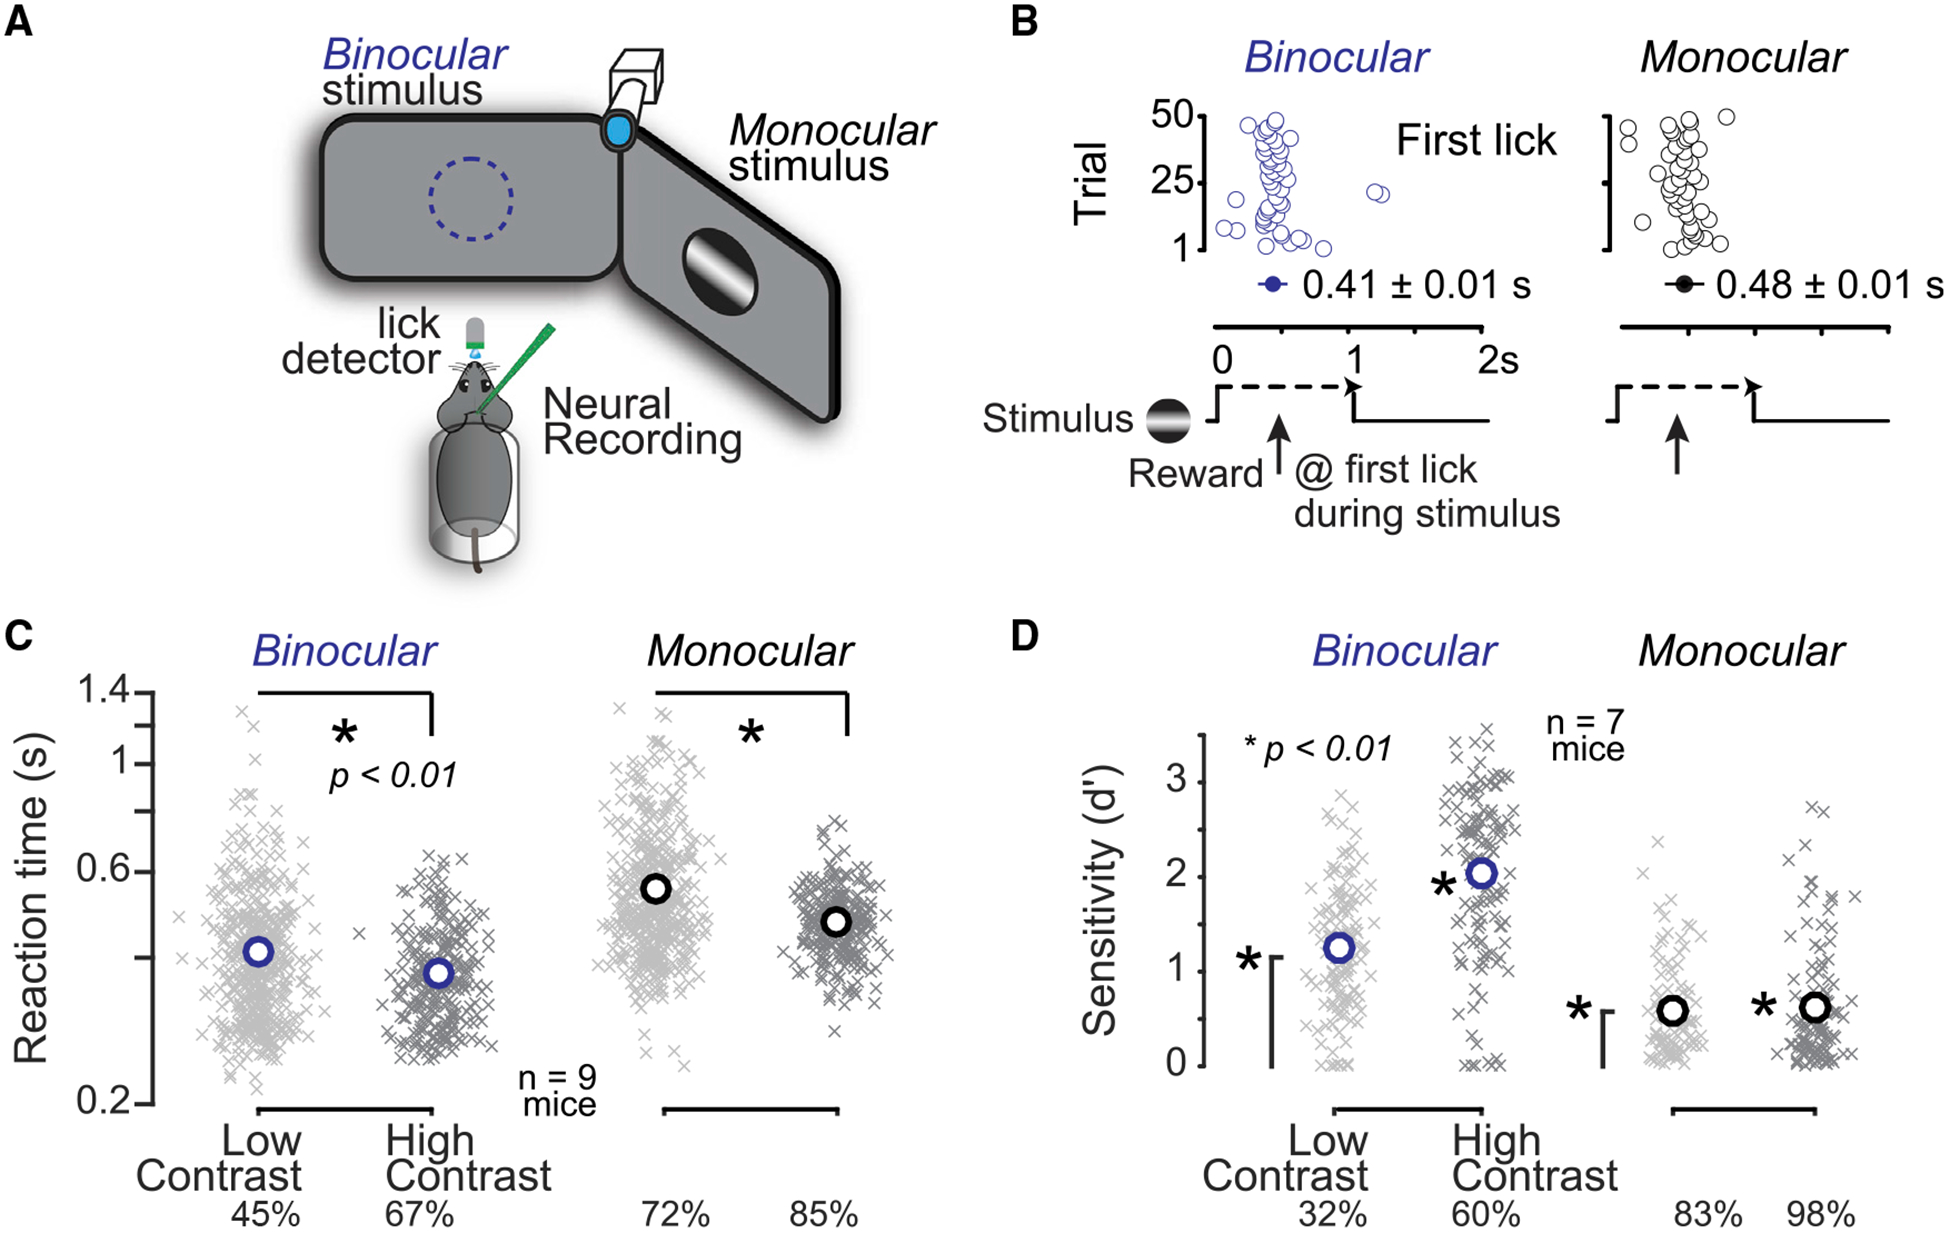
Figure 1. Visual Detection Latency and Sensitivity Depend upon Spatial Location.

(A) Head-fixed mice faced two monitors placed in the binocular (blue) and monocular (black) visual fields. Mice reported detection of visual stimuli (gratings) by licking for water. A photosensor recorded licks, a camera monitored the right eye, and silicon probes recorded activity in the left hemisphere. (B) Example session of visual detection, where stimuli appeared in one location for 50 consecutive trials, and then switched to the other location for 50 trials. Mice obtained reward upon first lick (open circles) during the stimulus presentation window (1-s duration). Reaction times were faster for binocular (blue) versus monocular detection (black). (C) Reaction times decreased with increased stimulus contrast. Crosses indicate mean reaction time per block of 10–50 trials, circles indicate population mean reaction time (n = 9 mice, 752 blocks, >30k trials; last quartile of total training sessions). Binocular (blue): low contrast, 0.41 ± 0.04 s; high contrast, 0.37 ± 0.03; mean ± SEM; p < 0.01 rank sum test. Monocular (black): low contrast, 0.56 ± 0.06 s; high contrast, 0.47 ± 0.03; mean ± SEM; p < 0.01 rank sum test. Binocular low and high contrasts (mean), 45% and 67%; monocular low and high contrasts (mean), 72% and 85%. (D) Detection sensitivity (d′) improved with higher stimulus contrast. Crosses indicate d′ per daily session (n = 7 mice, 475 sessions, >115k trials from last quartile of training days). Circles indicate population mean. Binocular (blue): low contrast, 1.25 ± 0.06; high contrast, 2.04 ± 0.08; mean ± SEM; monocular (black): low contrast, 0.59 ± 0.05; high contrast, 0.62 ± 0.06; mean ± SEM. All population means significantly greater than chance level (p < 0.01, sign test). Binocular sensitivity varied significantly with contrast (p < 0.01, rank sum test). Monocular sensitivity not different with contrast (p = 0.4). Binocular contrast means: 32% and 60%; monocular contrast means: 83% and 98%. Behavioral performance required V1 activity (Figure S1).
