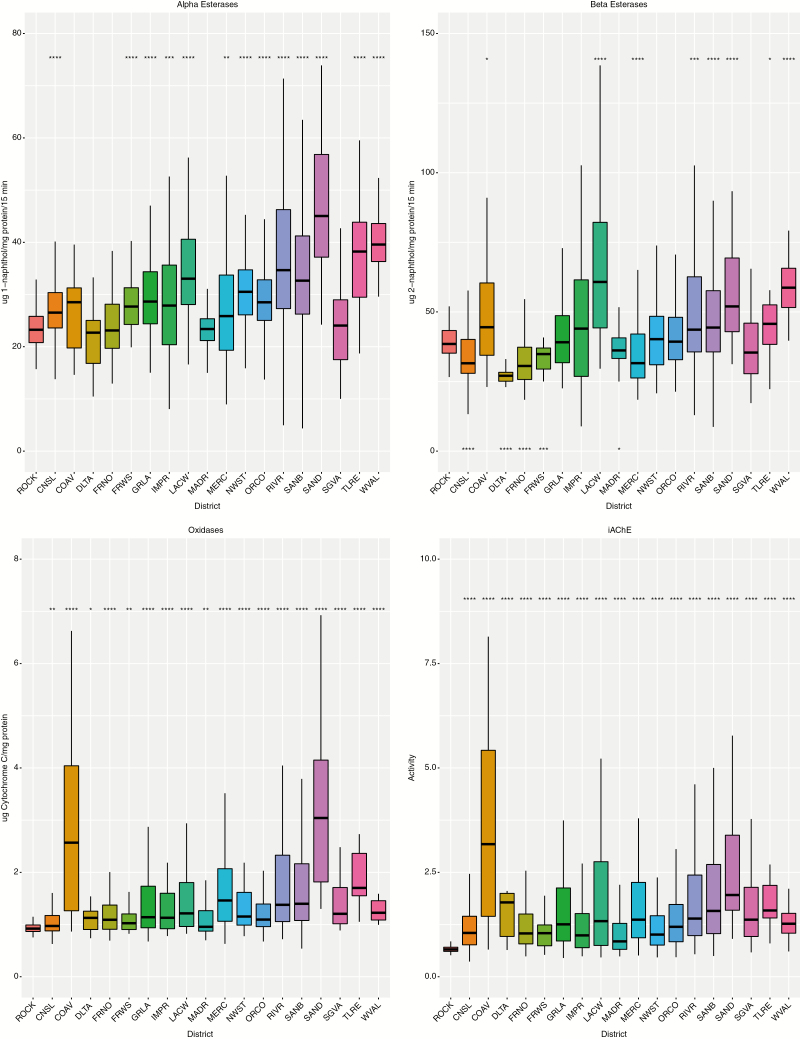
Fig. 2.
Boxplot of detoxification enzyme levels measured in Aedes aegypti from 2017 to 2018 (combined). * On the top of graph indicates statistically significantly differences between Ae. aegypti sampled by vector control agency and the susceptible ROCK strain. (P-value < 0.05) higher; * on the bottom of graph indicated significantly (P-value < 0.05) less. ROCK: Aedes aegypti Rockefeller susceptible strain. *P < 0.05, **P < 0.01, ***P < 0.001, ****P < 0.0001.

