Figure 4.

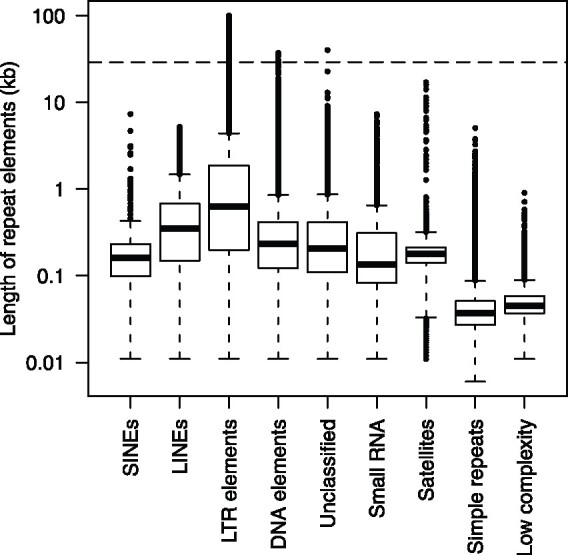
Distribution of repeat element lengths. Lengths of repeat elements were indicated by box plots. A horizontal dash line indicates the read N50 of sequence reads of ‘Okute-Sakurajima’.

Distribution of repeat element lengths. Lengths of repeat elements were indicated by box plots. A horizontal dash line indicates the read N50 of sequence reads of ‘Okute-Sakurajima’.