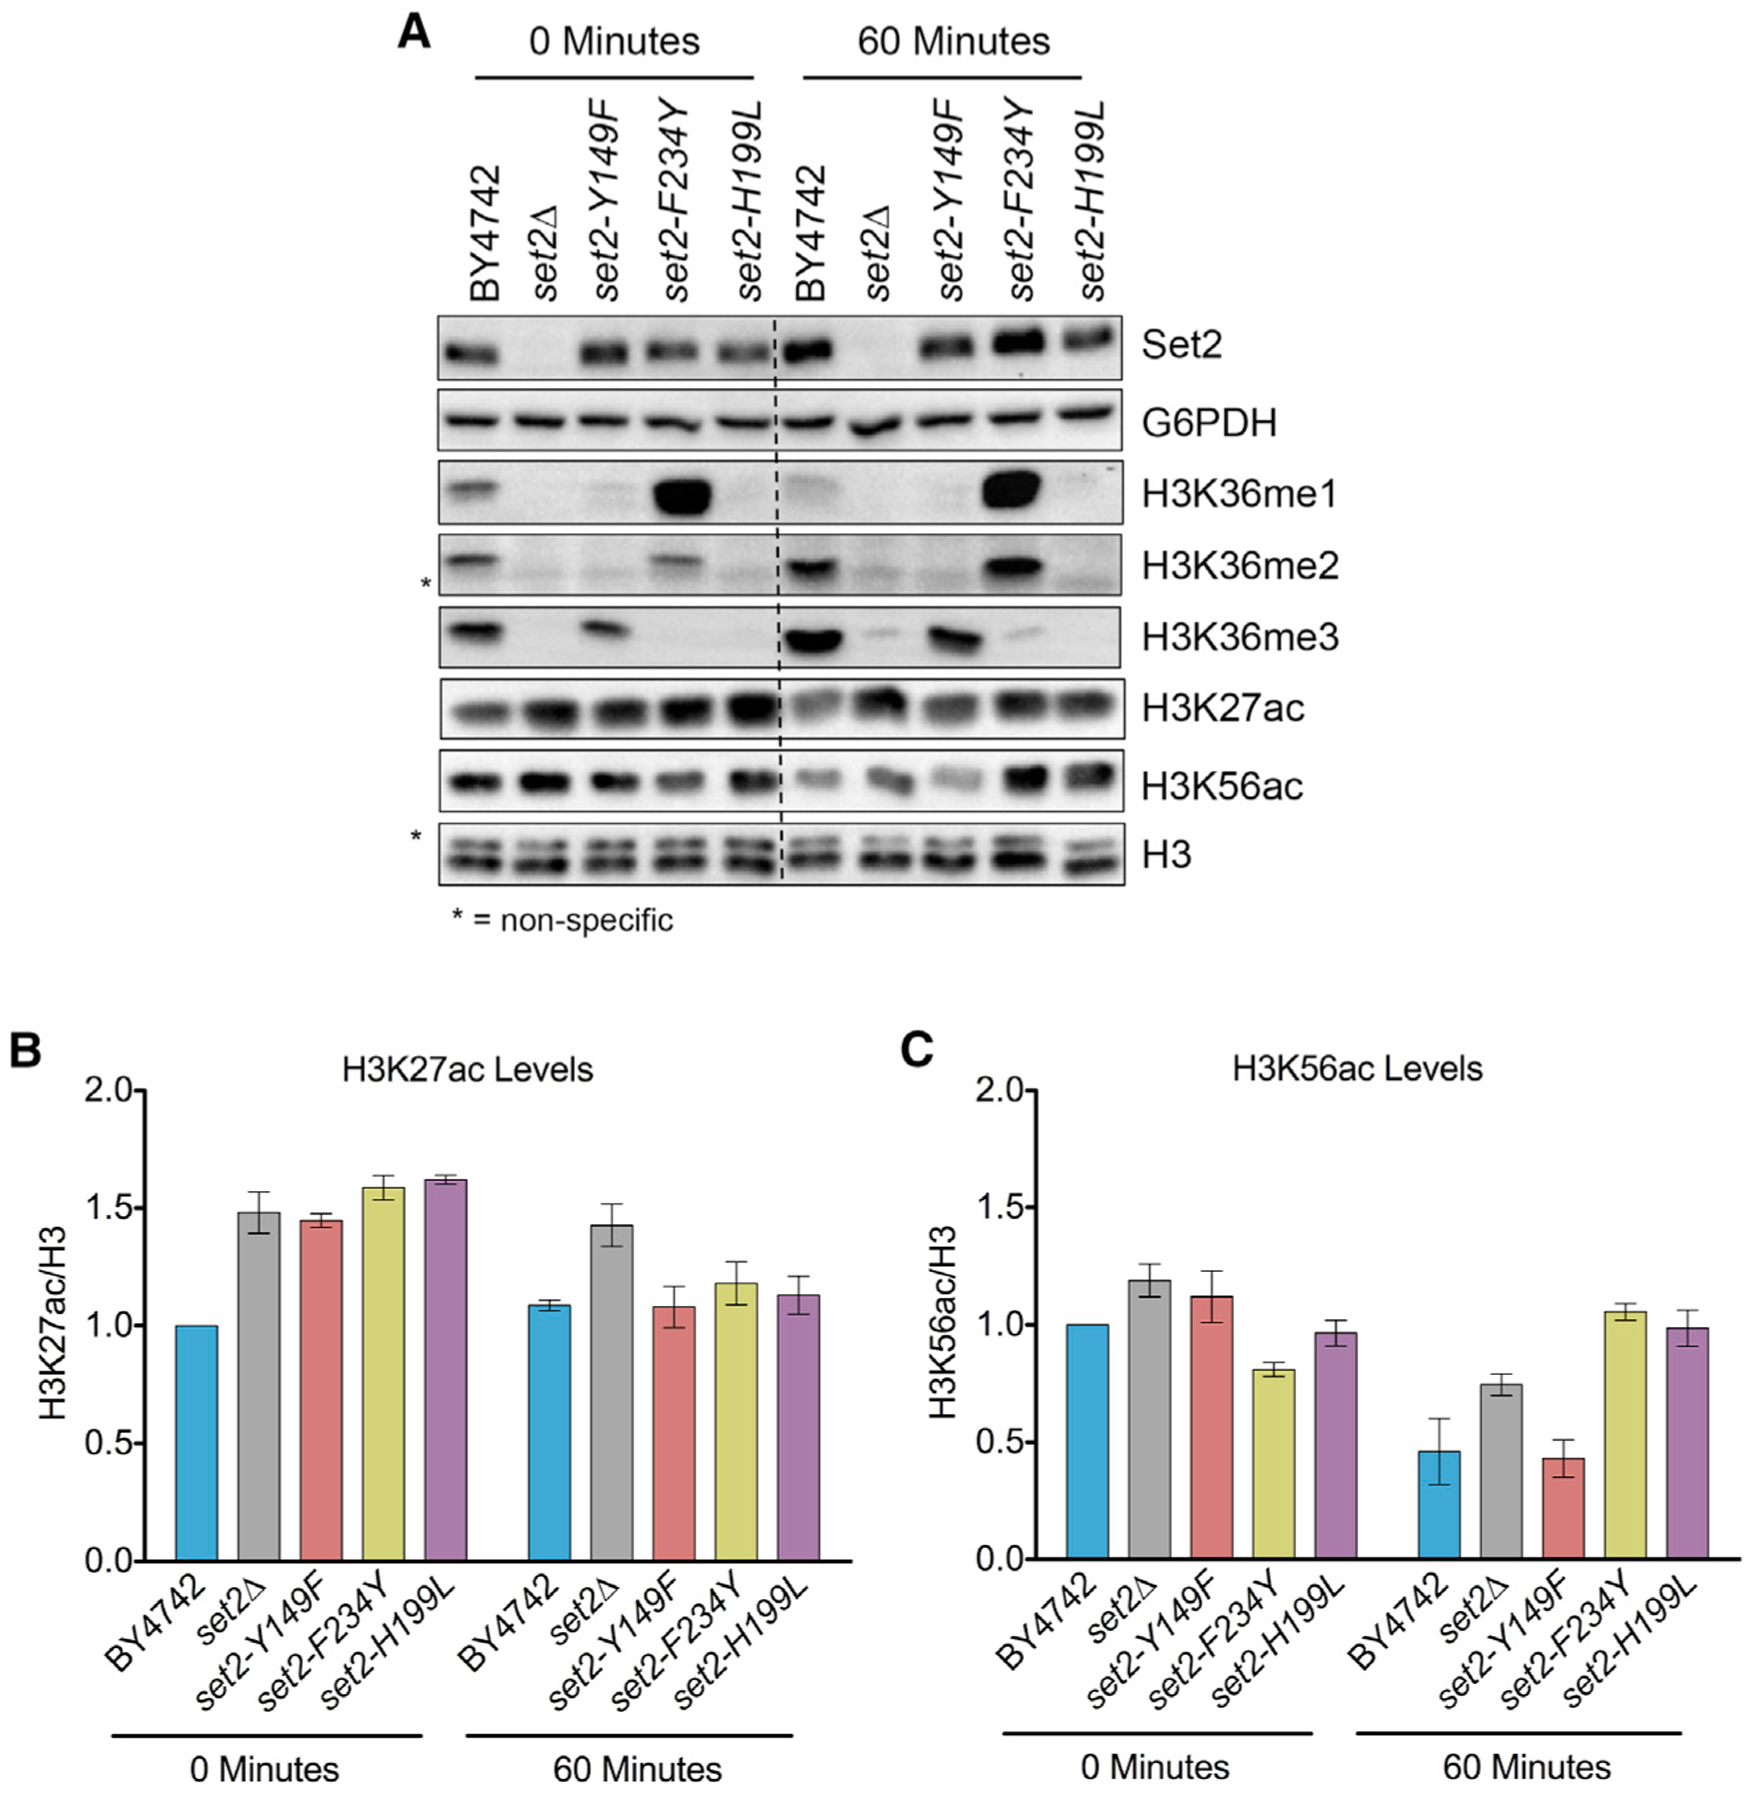
Figure 6. Alteration of Global H3K27ac and H3K56ac in set2 Methylation Mutants.

(A) Western blots of indicated strains probed with Set2, H3K36me1, H3K36me2, H3K36me3, H3K27ac, and H3K56ac antibodies. G6PDH and H3 served as loading controls. (B and C) Quantification of H3K27ac (B) and H3K56ac (C) normalized to H3. All measurements are normalized relative to BY4742 at 0 min. Each bar graph is representative of mean ± SEM of two or more independent biological replicates with a representative replicate shown in (A).
