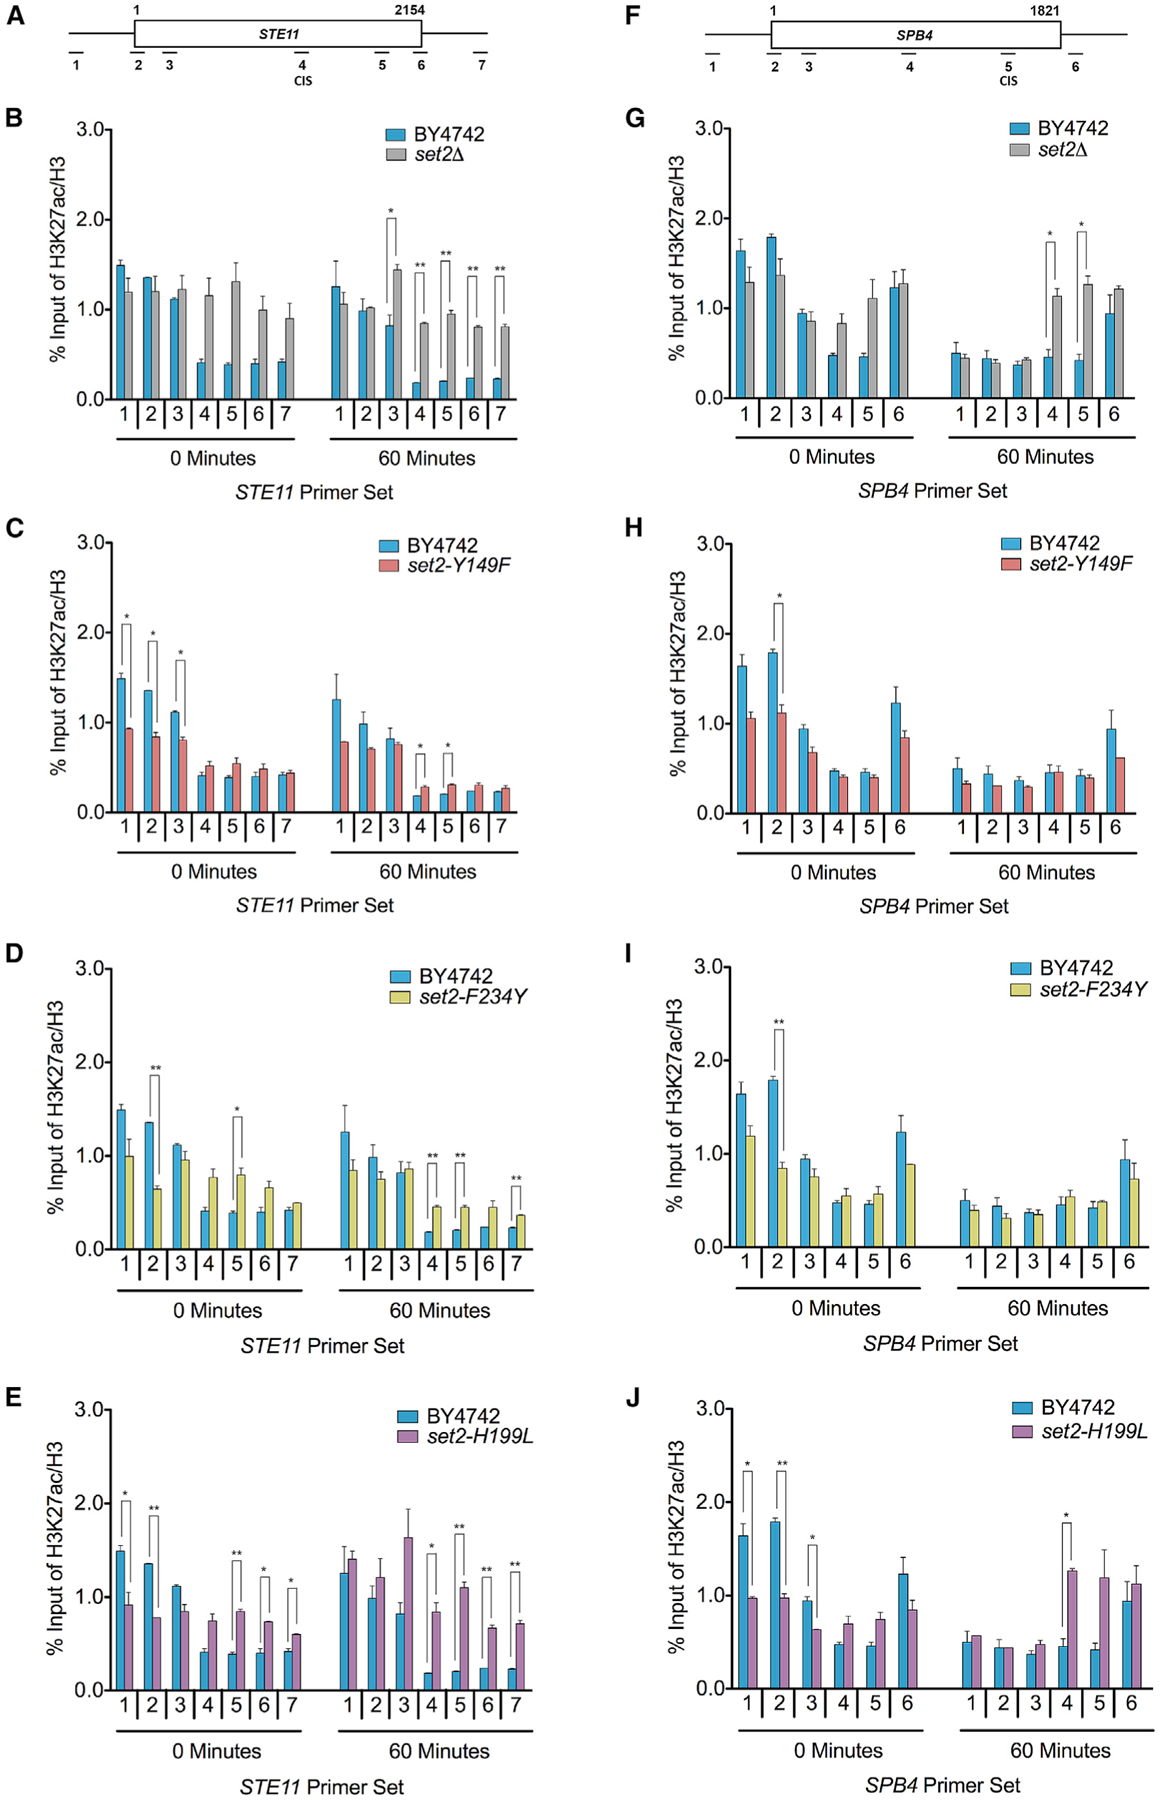
Figure 7. H3K36me1/2 and H3K36me3 Are Important for Proper H3K27ac Localization.

(A) Schematic of STE11 with amplicons indicated below. Predicted CIS located within primer set 4. (B–E) ChIP analysis of H3K27ac across STE11 in the indicated strains and time points. (F) Schematic of SPB4 with amplicons indicated below. Predicted CIS located within primer set 5. (G–J) ChIP analysis of H3K27ac across SPB4 in the indicated strains and time points. Data represented as mean ± SEM of two independent biological replicates. Student’s t test was used to obtain p values. Asterisks indicate significance (*p < 0.05; **p < 0.01); non-significant comparisons are not shown. All qPCR primers are listed in Table S3.
