
Fig 6.
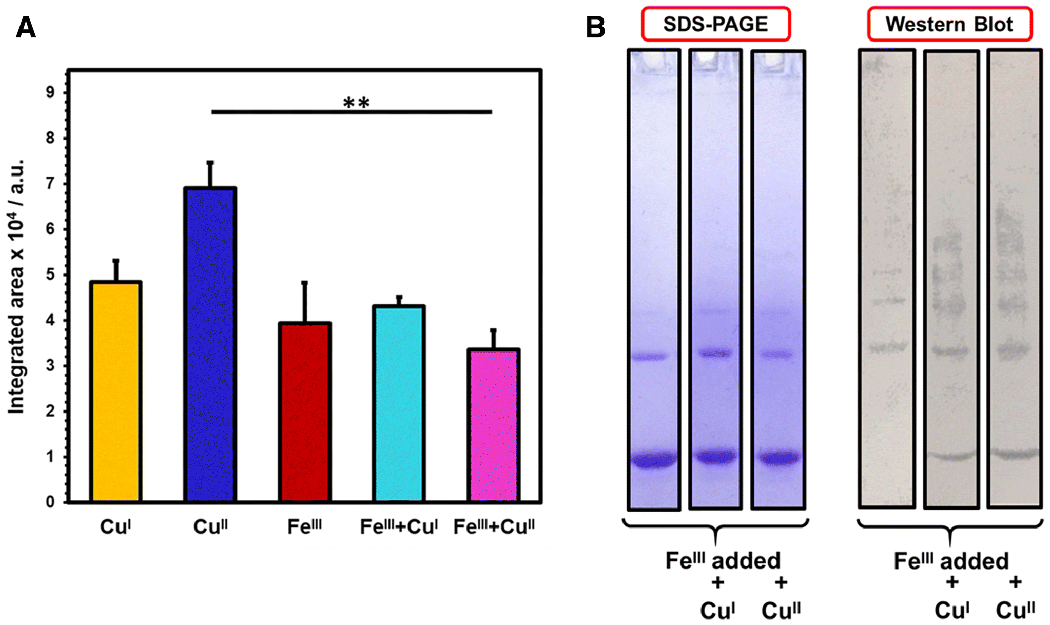
Analysis of dityrosine crosslinks upon PICUP implementation on FeIII supplemented NAcαS samples. A) Bar graph corresponding to dityrosine fluorescence emission resulted from different metal combinations; NAcαS-CuI (yellow), NAcαS-CuII (blue), NAcαS-FeIII (red), NAcαS-FeIII followed by immediate addition of CuI (teal), and NAcαS-FeIII followed by immediate addition of CuII (magenta). The results are expressed as mean ± standard error. **p < 0.01. B) SDS-PAGE gel (left) and corresponding anti-dityrosine western blot (right) of NAcαS-FeIII alone and metal combinations with CuI or CuII.