Figure 1.
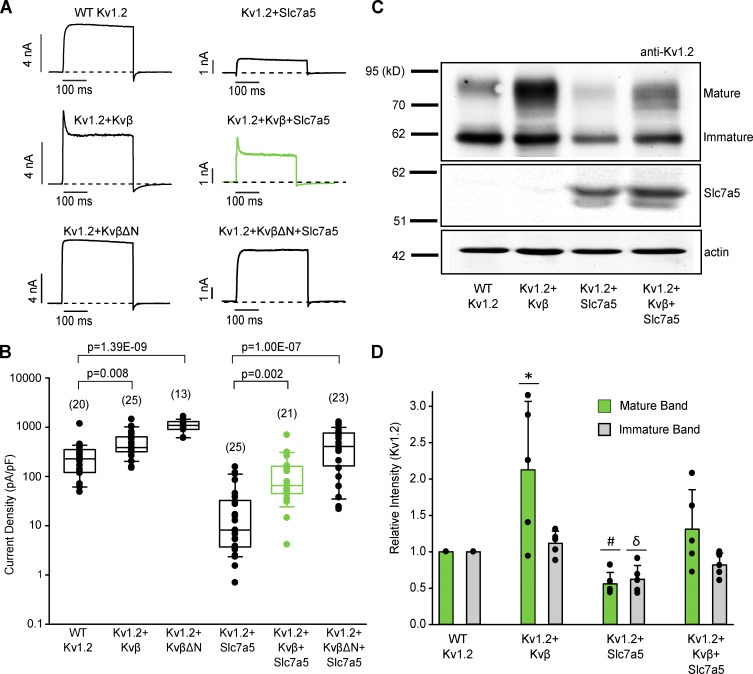
Kvβ offsets Slc7a5-mediated suppression of Kv1.2. (A) Combinations of Kv1.2, mCherry-Slc7a5, Kvβ, KvβΔN, and GFP were expressed in LM cells. Transfection ratios were (with Kv1.2 maintained constant using GFP) Kv1.2:Kvβ or KvβΔN (1:4); Kv1.2:Slc7a5 (1:0.5); and Kv1.2:Kvβ or KvβΔN:Slc7a5 (1:4:0.5). Representative current traces illustrating Kvβ-induced inactivation of Kv1.2 with or without Slc7a5 (300-ms step from −80 mV to +60 mV). (B) Current density was measured as the peak current at +60 mV (from a holding potential of −80 mV). The numbers above the box plots indicate the number of cells examined. A nonparametric Kruskal–Wallis ANOVA on ranks test, followed by a pairwise multiple comparison (Dunn’s) post hoc test, was used to compare between groups (P values are denoted above the box plots). (C) Representative Western blot of overexpressed Kv1.2 and Slc7a5 protein from HEK293 cells transfected as in A for 72 h. Actin was used as a loading control. (D) Densitometry measurements of mature (green bars) and immature (gray bars) Kv1.2 protein bands. ANOVA followed by Dunnett’s post hoc test was used to compare between groups for each band. Data from individual experiments are superimposed on bars that depict the mean values ± SD (n = 5 independent Western blot experiments). *, P = 0.016 relative to the respective WT Kv1.2 mature band; #, P = 6.67 × 10⁻⁵ relative to the respective WT Kv1.2 mature band; δ, P = 0.0008 relative to the respective WT Kv1.2 immature band. Box plots depict the median, 25th, and 75th percentiles (box) and the 10th and 90th percentiles (whiskers).

