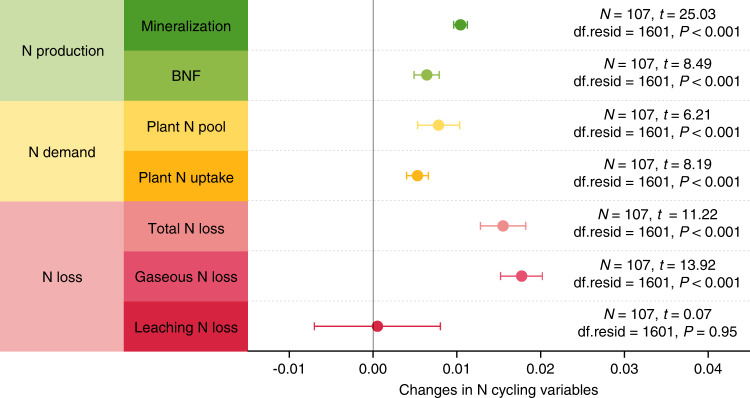
Fig. 3. Temporal dynamics of N production, demand and loss.
Changes in production of available N are reflected by annual soil N mineralization and biological N fixation rates (BNF), changes in plant N demand are represented by plant N pool and annual plant N uptake rate, and changes in ecosystem N loss are indicated by gaseous N loss, leaching N loss and total N loss (sum of gaseous and leaching N losses) over 2000s~2010s. Data of the N cycling variables were derived from the DeNitrification-DeComposition (DNDC) simulations. Changes in N cycling variables were characterized by the slope of relationship between an indicator and the fixed effect (year), which were examined with linear mixed-effects models after data normalization. Points in the plot denote the estimated model slopes and error bars represent 95% confidence intervals. N, the number of sites used for analyzing temporal dynamics of each indicator; df.resid, residual degrees of freedom.

