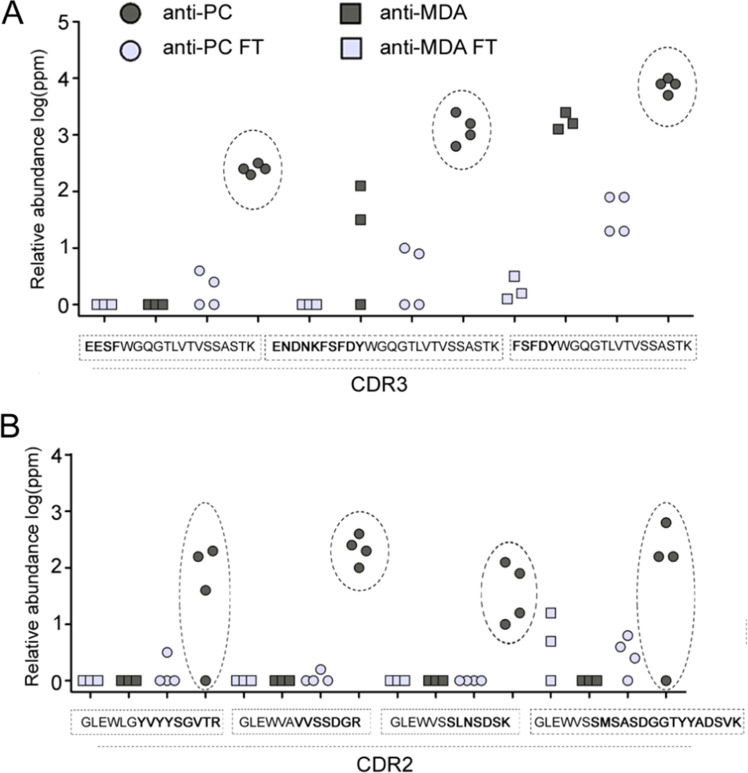
Figure 4.
Proteomics analysis. Similarities and differences between the polyclonal anti-PC and anti-MDA IgM variable regions. Differences in the heavy variable chain CDR2 and CDR3 regions between polyclonal anti-PC IgM and non-anti-PC IgM (flowthrough, FT) as well as anti-MDA and anti-MDA-FT samples. The data was generated via quantitative proteomics de novo sequencing analysis. Numbers are reported as log(ppm) of the relative variable region peptide distributions in respective sample. (A) Peptides from the HV CDR3 region that were elevated in the anti-MDA IgM and/or anti-PC samples. (B) Peptides from the HV CDR2 region that were elevated in the anti-PC IgM samples.

