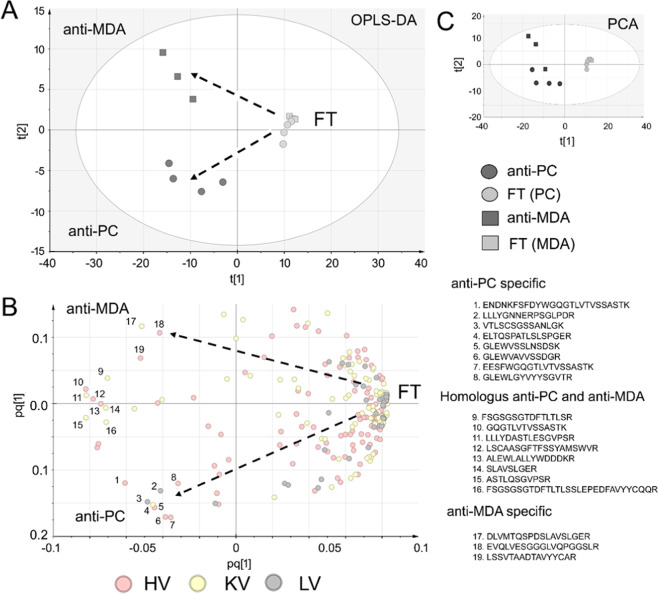
Figure 5.
Differences in the heavy variable chain regions between the anti-PC, anti-MDA and FT samples as determined via multivariate data analysis using the proteomics de novo sequencing quantitative data. (A) Scores plot of the OPLS-DA multivariate analysis of the anti-PC samples (group 1), anti-MDA samples (group 2) and anti-PC-FT and anti-MDA-FT samples (group 3) using heavy variable, lambda variable and kappa variable chain peptides that were identified in both FT and anti-PC or anti-MDA samples or identified in anti-PC or anti-MDA only. The generated model (R2 = 0.9, Q2 = 0.7, p = 0.0003) contained two predictive components (axis x and axis y). The scores plot shows distinct separation between the FT and antigen specific IgM samples along the x-axis and separation between the anti-MDA and anti-PC IgM samples along the y-axis. (B) Loading plot showing how the peptides correlate with respective subgroup. From the plot it is evident that the majority of peptides correlate with the FT but that particular peptides are specific for anti-PC (nr. 1–8) and anti-MDA (nr 17–19). Furthermore, a number of peptides (those negatively correlating with the FT and oriented between anti-MDA and anti-PC), are peptides that were elevated in both anti-PC and anti-MDA IgM but low in abundance (or missing) in the FT (nr. 9–16). Note that we have previously described nr 11–17 and 19 as anti-MDA specific15. (C) The corresponding PCA scores plot of the data.

