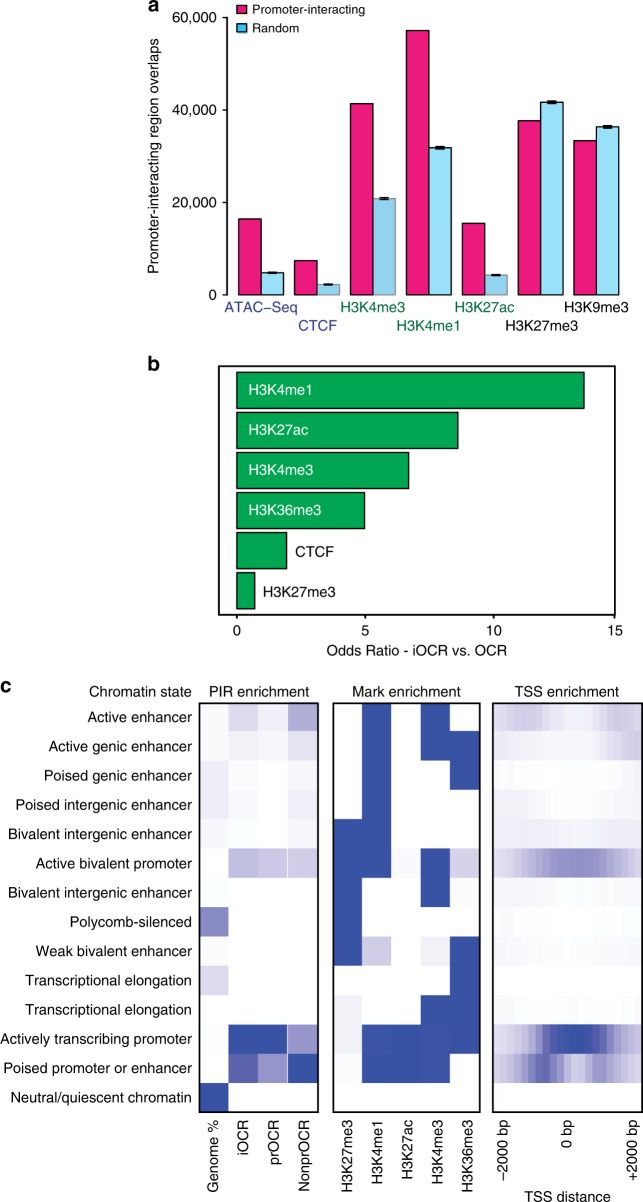
Fig. 4. Enrichment of chromatin signatures at promoter-interacting regions.
a PIR enrichment for genomic features compared with distance-matched random regions in naive T cells using CHiCAGO. Mean ± 95% CI is depicted across 100 draws of non-significant interactions. b Feature enrichment at promoter-interacting OCR (iOCR) compared to a random sample of non-promoter-interacting OCR in naive T cells. c Enrichment of iOCR within chromHMM-defined chromatin states and TSS neighborhood in naive T cells. Fourteen ChromHMM state models based on 5 histone modifications (H3K4me1, H3K4me3, H3K27me3, H3K27ac, and H3K36me3) are shown in the middle panel, with blue color intensity representing the probability of observing the mark in each state. The heatmap to the left of the emission parameters displays the overlap fold enrichment for iOCR in promoters (prOCR) and non-promoter iOCR (nonprOCR), while the heatmap to the right shows the fold enrichment for each state within 2 kb around a set of TSS. Blue color intensity represents fold enrichment.

