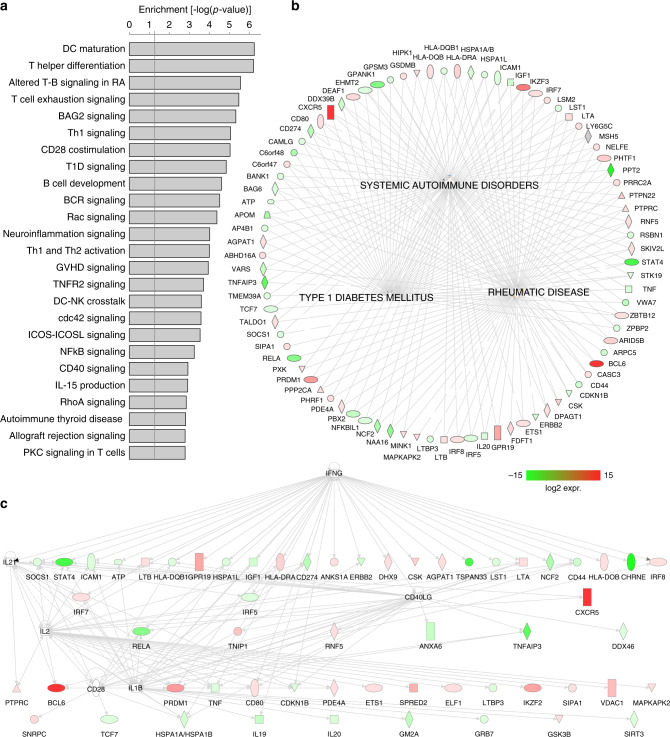
Fig. 7. Ontology and pathway analysis of genes implicated through integration of GWAS and promoter-open chromatin connectomes in follicular helper T cells from human tonsil.
a Enrichment of the top 25 canonical pathways (a) and 3 disease networks (b) among genes implicated through promoter-open chromatin connectomes in TFH as measured by one-sided Fisher exact test in the IPA platform. c Regulatory hierarchical network from SLE-connectome-implicated genes. Color gradients in b, c represent log2 expression changes between TFH and naive T cells, with green indicating downregulation and red indicating upregulation in TFH. Blue nodes in c represent regulatory hubs for genes with no SLE-OCR connectome detected.

