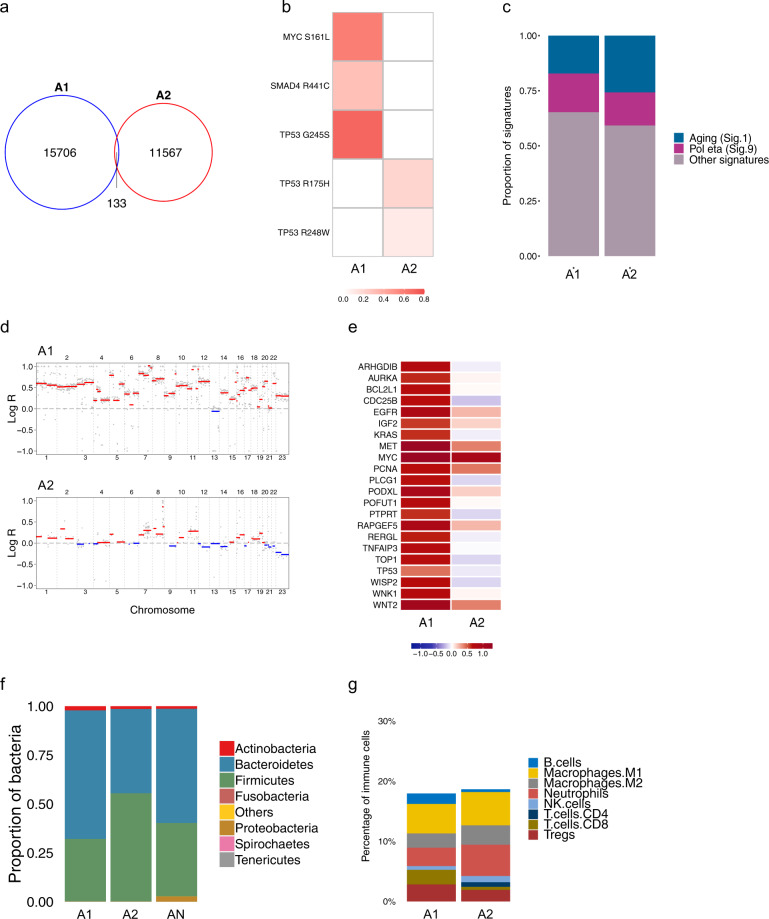
Fig. 1. Genomic and transcriptomic analyses for patient A.
a A Venn diagram of SNVs shows 0.49% overlap between tumours. b Variant Allele Frequencies (VAFs) of putative driver mutations show heterogeneous drivers in A1 and A2. c Mutational signature analysis. d Genomic landscape of CNAs shows CIN in both A1 (ploidy of 3.58) and A2 (ploidy of 2.2). e Log-ratio of putative driver CNAs highlights heterogeneity of tumourigenic events between A1 and A2. f Microbial analysis of DNA data shows microbial abundance at the phylum level. g Quantification of tumour immune infiltration for eight immune cell populations across A1 and A2.

