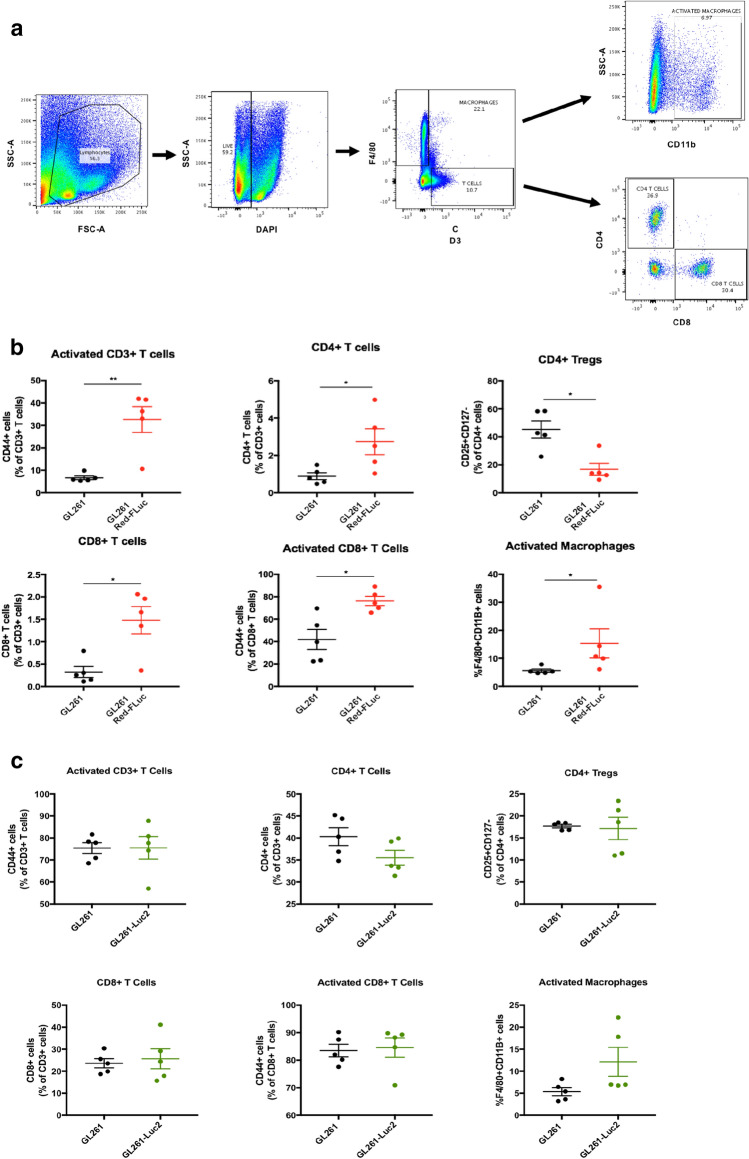
Figure 2.
(a) Displays the various cell populations gated for F4/80 + macrophages and CD3+ T cells. CD3+ T-cell subsets were then fractioned by CD4 and CD8 positivity. (b) Shows the frequencies of immune cells observed in the GL261 and GL261 Red-FLuc implanted brains dissociated into a single cell suspension 10 days post-implantation. (c) Displays a panel of immune cell frequencies observed in GL261 and GL261-Luc2 implanted brains. Statistical significance was determined by Mann–Whitney U test with P-values of less than 0.05 considered statistically significant. All images in this figure were made using GraphPad Prism 8.3.0 (580) https://www.graphpad.com/scientific-software/prism/, Microsoft PowerPoint Office 365 https://www.microsoft.com/enus/p/powerpoint/cfq7ttc0k7c6?activetab=pivot:overviewtab and FlowJo v10.6.2 https://www.flowjo.com/solutions/flowjo/downloads.

