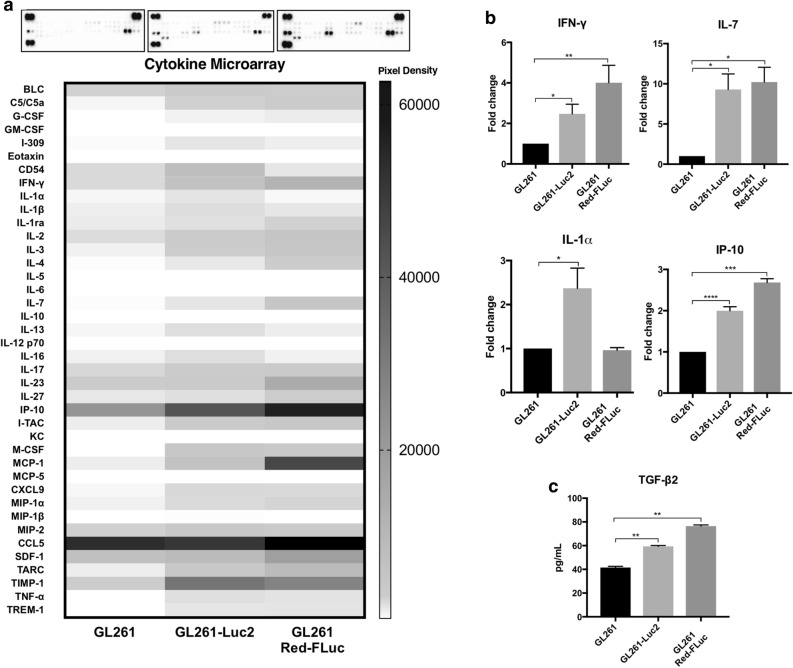
Figure 3.
(a) Representative protein microarray images display differential cytokine profiles and raw pixel density for each group, respectively. (b) Relative fold change was determined and shown for cytokines of interest. The data are presented as means ± SEM, n = 3 for each group with (*P < 0.05, **P < 0.01, ***P < 0.001) by One-way ANOVA. Bar graphs show differential protein expression for selected cytokines of interest. (c) TGF-β2 ELISAs results show upregulated TGF-β2 expression measured in pg/mL for GL261 Red-FLuc and GL261-Luc2 compared to GL261 cells. All images in this figure were made using GraphPad Prism 8.3.0 (580) https://www.graphpad.com/scientific-software/prism/ and Microsoft PowerPoint Office 365 https://www.microsoft.com/enus/p/powerpoint/cfq7ttc0k7c6?activetab=pivot:overviewtab.

