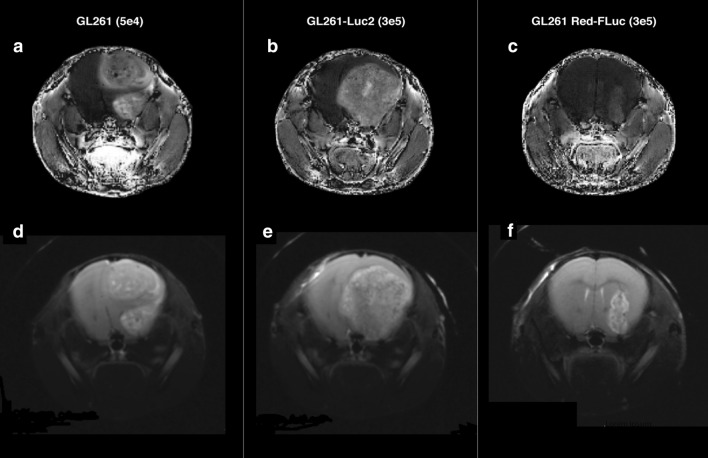
Figure 4.
T1-weighted MRI images (top) showing contrast-enhancing lesions for all three groups (a) GL261, (b) GL261-Luc2, and (c) GL261 Red-FLuc implanted tumors at respective tumor dose. T2-weighted MRI (bottom) of (d) GL261, (e) GL261-Luc2, and (f) GL261 Red-FLuc tumors with tumor volumes correlating with onset of neurological deficits and symptoms All images in this figure were created using Microsoft PowerPoint Office 365 https://www.microsoft.com/enus/p/powerpoint/cfq7ttc0k7c6?activetab=pivot:overviewtab and Osirix DICOM Viewer https://www.osirix-viewer.com/.

