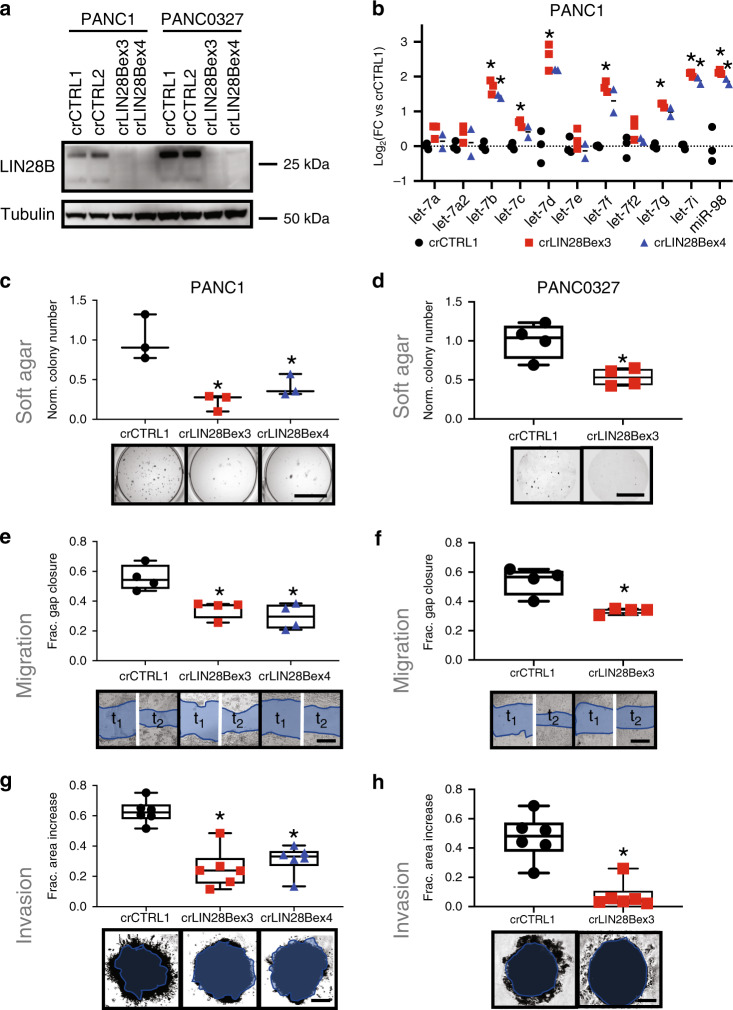
Fig. 3. CRISPR knockout of LIN28B in LIN28B-high PDAC cells causes a less aggressive phenotype.
a Western blot of PANC1 and PANC0327 cell lines after stable lentiviral transduction with either non-targeting gRNA (crCTRL1, crCTRL2) or gRNAs targeting LIN28B exon 3 (crLIN28Bex3.1) or exon 4 (crLIN28Bex4). These results were confirmed with at least 2 replicate assays. b qPCR for mature let-7 species in PANC1 LIN28B-knockout cells versus control cells. *p < 0.05, 2-sided t-test with Holm-Sidlak multiple testing adjustment, n = 3 per group. c, d Quantification and representative images taken from soft agar colony formation assays for PANC1 (c) or PANC0327 (d) cells after generation of stable LIN28B CRISPR knockout. *p < 0.05, 2-sided t-test using Bonferroni adjustment, n = 3–4 per group, median and 25–75% IQR shown by box plots. Scale bar = 10 mm. e, f Quantification and representative images of two-dimensional scratch migration assays for PANC1 (e) and PANC0327 cells (f) after generation of stable LIN28B CRISPR knockout. *p < 0.05, 2-sided t-test using Bonferroni adjustment, n = 4 per group, median and 25–75% IQR shown by box plots. Scale bar Is 500 mm. g, h Quantification and representative images of three-dimensional invasion through extracellular matrix gels for PANC1 (g) and PANC0327 cells (h) after generation of stable LIN28B CRISPR knockout. *p < 0.01, 2-sided t-test using Bonferroni adjustment, n = 6 per group, median and 25–75% IQR shown by box plots. Scale bar = 300 mm (g) and 200 mm (h).

