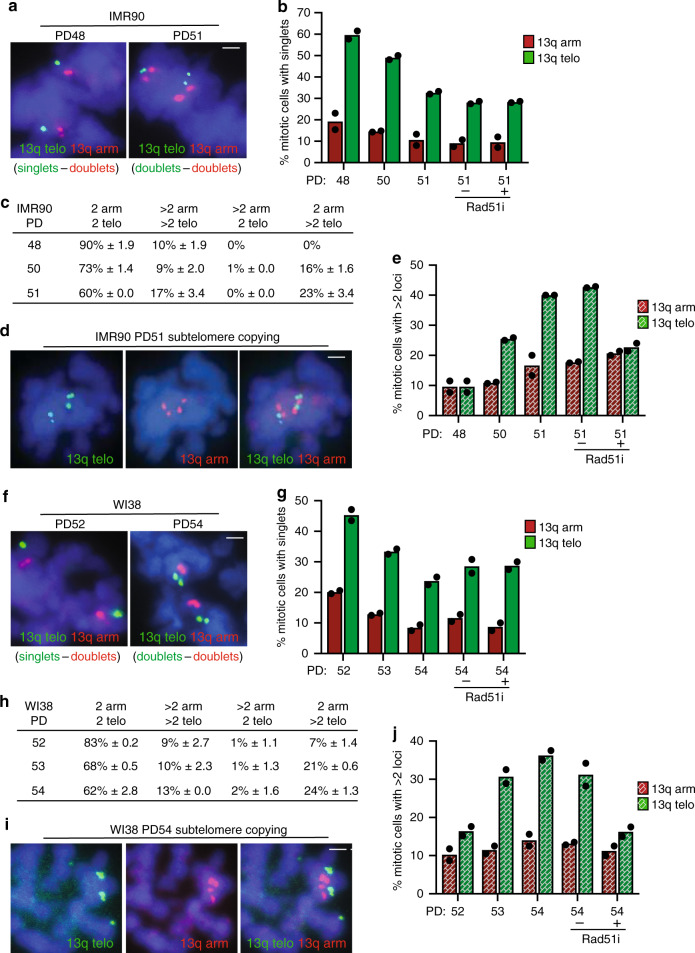
Fig. 7. Subtelomere recombination accompanies senescence onset.
a FISH analysis of late IMR90 mitotic cells at PD48 and the final PD51 with a dual 13q arm (red) and telo (green) probe. b Quantification of the frequency of mitotic cells with cohered 13q arms (red) or telos (green). Average of two independent experiments (n ≥ 25 cells each). c Table of 13q FISH categories scored in IMR90 cells at PD48, 50 and 51. Average of two independent experiments (n ≥ 25 cells each) ± SEM. d FISH analysis of a final PD51 IMR90 mitotic cell exhibiting subtelomere, but not arm, copying using a dual 13q arm (red) and telo (green) probe. e Quantification of the frequency of mitotic cells exhibiting subtelomere or arm copying. Average of two independent experiments (n ≥ 25 cells each). f FISH analysis of late WI38 mitotic cells at PD52 and the final PD54 with a dual 13q arm (red) and telo (green) probe. g Quantification of the frequency of mitotic cells with cohered 13q arms (red) or telos (green). Average of two independent experiments (n ≥ 32 cells each). h Table of 13q FISH categories scored in late WI38 mitotic cells at PD 52, 53, and the final PD54. Average of two independent experiments (n ≥ 32 cells each) ± SEM. i FISH analysis of a final PD54 WI38 mitotic cell exhibiting subtelomere, but not arm, copying using a dual 13q arm (red) and telo (green) probe. j Quantification of the frequency of mitotic cells exhibiting subtelomere copying. Average of two independent experiments (n ≥ 32 cells each). a, d, f, i DNA was stained with DAPI (blue). Scale bars represent 2 μm. Experiments were repeated independently twice (for a, d, f, i) with similar results. Source data are provided as a Source Data file.

