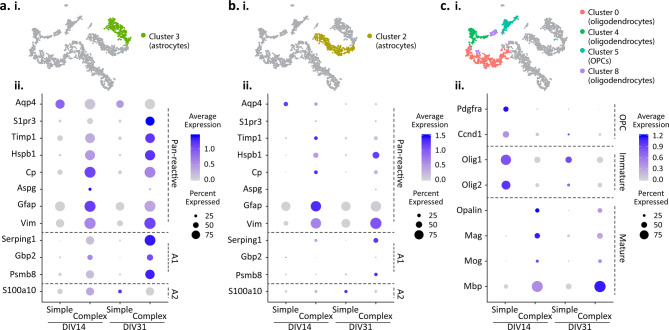
Figure 6.
Characterization of astrocytes and oligodendrocytes. Dot plots represent key cell type marker gene expression within simple and complex cultures at DIV14 and DIV31. (a, i) t-SNE plot illustrating cluster 3 of astrocytes; (a, ii) Dot plot of cluster 3 astrocytes. (b, i) t-SNE plot illustrating cluster 2 of astrocytes. (b, ii) Dot plot of cluster 2 astrocytes (c, i) t-SNE plot illustrating clusters of oligodendrocytes. (c, ii) Dot plot of oligodendrocytes. Dot size indicates proportion of cells in cluster that express a gene; the shading indicates the average level of expression (low to high indicated as light to dark purple).

