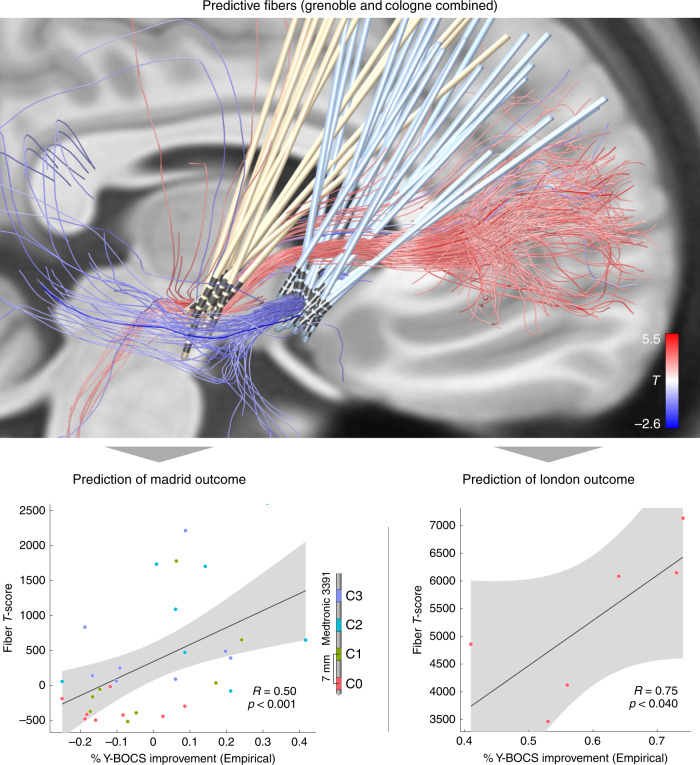
Fig. 4. Predictions in test cohorts.
Top: predictive fibers calculated on both training cohorts (Cologne & Grenoble) irrespective of their target. Red fibers are positively associated with clinical improvement, blue fibers negatively. Bottom: the sum of aggregated fiber T-scores under each VTA predicted %-Y-BOCS improvements in eight patients with four settings each (N = 32 stimulations) of the Madrid cohort (left) and six patients of the London cohort with dual stimulation (four electrodes) of STN and ALIC (right). Gray shaded areas represent 95% confidence intervals. Please note that p-values in this manuscript are based on random permutation testing. Based on classical tests, the result shown in the lower right panel would remain significant in a one-sided test, only (p-one-sided = 0.044, p-two-sided = 0.089). A replication of this result based on anatomically predefined pathways is shown in Supplementary Fig. 2.

