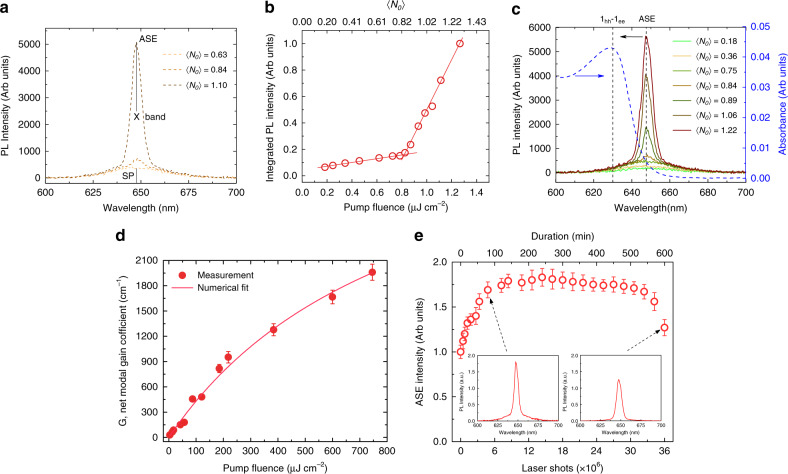
Fig. 3. ASE, VSL, and optical gain stability characterizations of the CQWs having four monolayers of shell.
a Pump-dependent ASE spectra at 〈No〉 = 0.63, 0.84, and 1.10. The position of spontaneous emission (SP), ASE and X-band are marked by solid black line. b Integrated PL intensity of ASE spectra as a function of the pump fluence and the corresponding average number of excitons per NPL (〈No〉). c Spectral analysis of ASE along with absorbance (dashed blue line) of the lowest excitonic energy state with respect to the 〈No〉. The position of 1hh–1e excitonic transition and ASE peak are marked by dark dashed lines. d Pump-dependent net peak modal gain coefficient (symbols) at the ASE peak position (λASE = 647 nm). The solid line is the numerical fitting to the experimental data, indicating a saturation fluence at ~920 μJ cm−2. The highest G reaches 1960 ± 100 cm−1 at 746 μJ cm−2 pump fluence. Error bars in this figure are a result of uncertainty of the fitting parameter in the variable stripe length measurement presented in Supplementary Fig. 7 as exemplary cases. e Pump-dependent ASE intensity as a function of the pump laser shot at 〈No〉 = 1.36. Error bars in this figure comes from the fluctuations in the ASE intensity between different measurements. The light amplification is highly stable in these engineered CQWs even for 9.5 h of continuous excitation.

