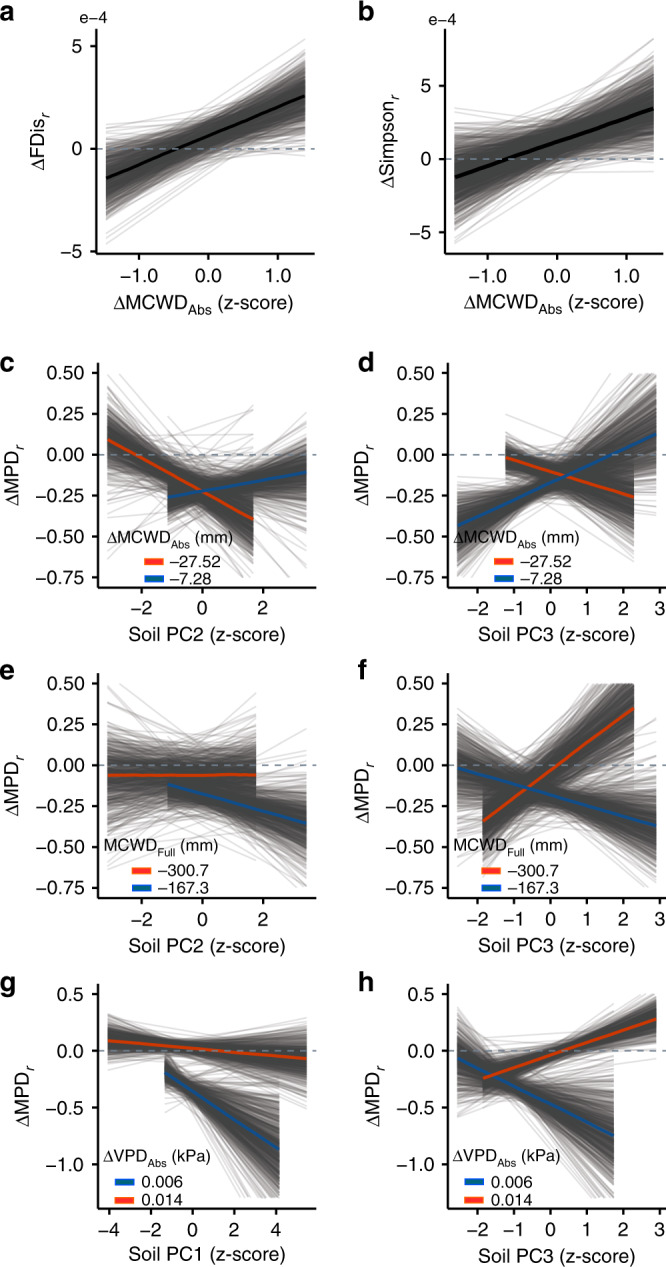
Fig. 3. Climatic and soil drivers of observed rates of change in the three facets of diversity.

a Functional (ΔFDisr), b taxonomic (ΔSimpsonr) and c–h phylogenetic (ΔMPDr) diversity in West African forest communities. Changes in functional and taxonomic diversity were mainly explained by the absolute changes in the maximum climatic water deficit (ΔMCWDAbs). Observed changes in phylogenetic diversity were better explained by the soil characteristics covered by the three PC axes (Supplementary Table 3) and their interaction with climatic drivers (ΔMCWDAbs, ΔMCWDFull, ΔVPDAbs). PC1: eCEC(+), magnesium(+) and nitrogen(+); PC2: pH(−), Fe(+) and Ca(−); PC3: %Clay(−) and %Sand(+). The solid black fitted line shows the mean posterior prediction for the functional and taxonym diversity change models. The red and blue fitted lines shows the mean posterior predictions for the phylogenetic diversity based on the minimum and maximum values of the climatic drivers included in the model (Table 1). Grey lines show 700 random draws from the posterior distribution representing variability of the expected model fit. n = 21 unique vegetation plots.
