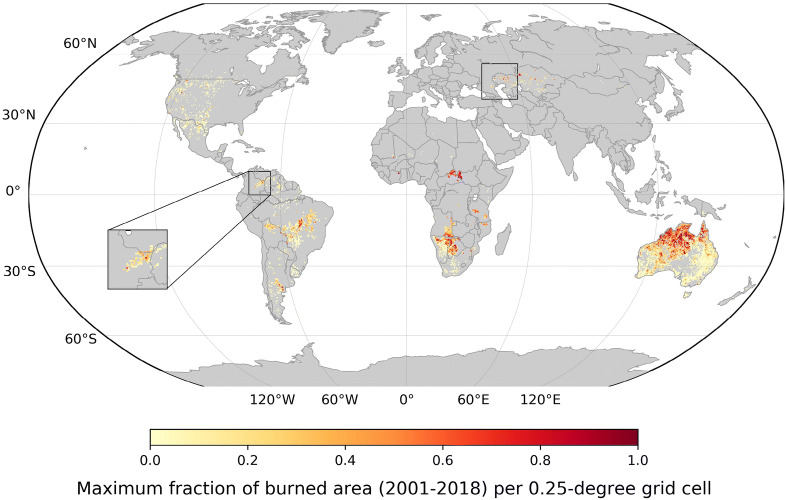
Figure 1.
Largest wildfires located in (sub-)tropical regions. Maximum monthly burned area during 2001–2018, as a fraction to the total land area per 0.25 degree grid cell. Grid cells selected considering population density, data quality, and availability of multiple data streams used in this study (see Methods). Black squares show example countries showing spatial variations in the burned area size along the borders. The map is created using the Matplotlib basemap v1.3.0 toolkit55.

