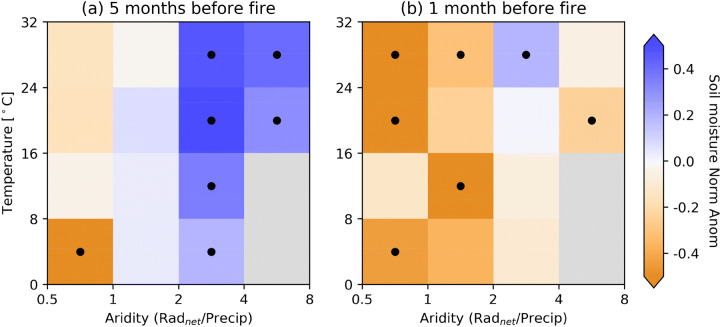
Figure 2.
Consecutive wet and dry soil moisture conditions promote wildfires. Normalised soil moisture anomalies at (a) 5 months and (b) 1 month before the month with the largest burned area. Grid cells are grouped with respect to long-term temperature and aridity. Median values across grid cells in each box are shown. Boxes with less than 25 grid cells are discarded and shown in gray. Black dots within the boxes denote significant anomalies at the 90%-level.

