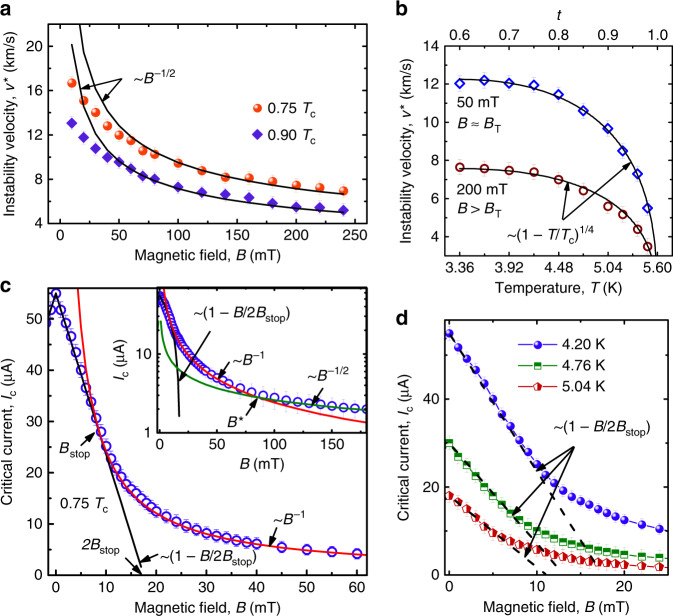
Fig. 3. Instability velocity and critical current in the microstrip.
a Instability velocity v* as a function of the magnetic field. Red spheres and blue diamonds: experiment. Solid lines: fits to Eq. (2). b Temperature dependence of the instability velocity at 50 and 200 mT. Blue diamonds and brown circles: experiment. Solid lines: fits to Eq. (1). c Crossover from the linear dependence Ic(B) at B < Bstop to Ic(B) ~ 1/B for Bstop < B < B* and for B > B* at 4.20 K. Blue spheres: experiment. Solid lines: fits as labeled close to the curves. The inset shows the same data in versus B representation. d Dependence of the critical current Ic of the microstrip on the magnetic field at three different temperatures, as indicated. Symbols: experiment. Black dashed lines: linear fits. The error bars are the standard error of the mean.

